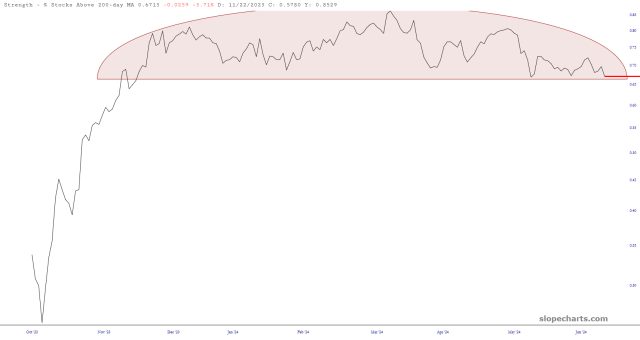
The symbol $SPX200MA in SlopeCharts, which displays the percentage of stocks above their 200-day moving average, is deliciously close to completion. If we can get beneath this pattern, I’m expecting an amazing July.
Slope initially began as a blog, so this is where most of the website’s content resides. Here we have tens of thousands of posts dating back over a decade. These are listed in reverse chronological order. Click on any category icon below to see posts tagged with that particular subject, or click on a word in the category cloud on the right side of the screen for more specific choices.
The symbol $SPX200MA in SlopeCharts, which displays the percentage of stocks above their 200-day moving average, is deliciously close to completion. If we can get beneath this pattern, I’m expecting an amazing July.
It’s good to know that earnings season is just a few weeks away, and the Fed-fueled gravy train is going to be discovered to be – – well – – out of gravy, I guess. As we look at the /ES pre-market, the lengthy range-bound stall-out is, in my opinion, about to break down into a lusty swoon.

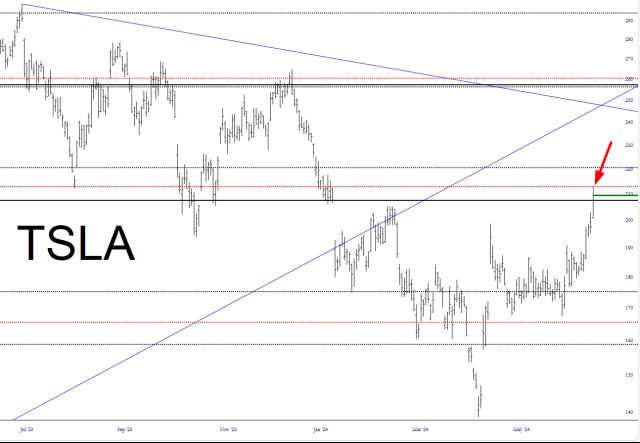
Tesla’s strength recently has been impressive. These Fibonacci levels still count, however (notice resistance at red arrow for Monday), and I’d say very firm resistance awaits at $220.