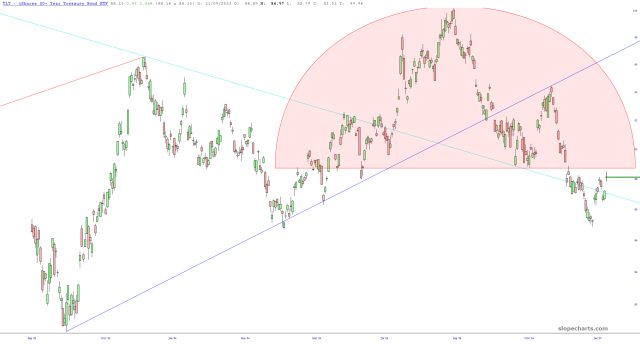
Here is a chart of joblessness over the past thirty of a century. Look like it’s about to pulse up to you? Yeah, me too.
Slope initially began as a blog, so this is where most of the website’s content resides. Here we have tens of thousands of posts dating back over a decade. These are listed in reverse chronological order. Click on any category icon below to see posts tagged with that particular subject, or click on a word in the category cloud on the right side of the screen for more specific choices.
Here is a chart of joblessness over the past thirty of a century. Look like it’s about to pulse up to you? Yeah, me too.
A few days ago, I did a post called Old Grandad which related the tale of a young man who took his entire $1.2 million inheritance, shoved it into the “sure thing” of March 21 $40 calls on DJT, and promptly lost $500,000.
In the bizarre video he did, which was sort of a financial sadomasochism kink-fest, he was crying that the options had crumbled in value to about $5.05. People BEGGED him to take his losses and be done with it, but he steadfastly refused.
Well, I just looked, and that $5.05 would look awfully good right now. The current bid on the option is $1.45, less than a third of its value during the freak-out video. In other words, his $500,000 loss has blossomed to over $1,000,000. Notice how much bigger the open interest is than the other strikes? Yeah, that’s him.

It has been said many times over decades that copper is an excellent canary in the proverbial coal mine for judging where the economy is heading. May I direct your attention Freeport McMoRan (or fREEPORT mCmOrAN if you like) symbol FCX. Looks like doom to me!

Evidently, there is a security (symbol /IND50 in SlopeCharts) representing the “Nifty 50” in Singapore. This is one of the cleanest looking H&S tops I’ve ever seen! Just thought I’d mention it, even though most of us don’t trade overseas.