
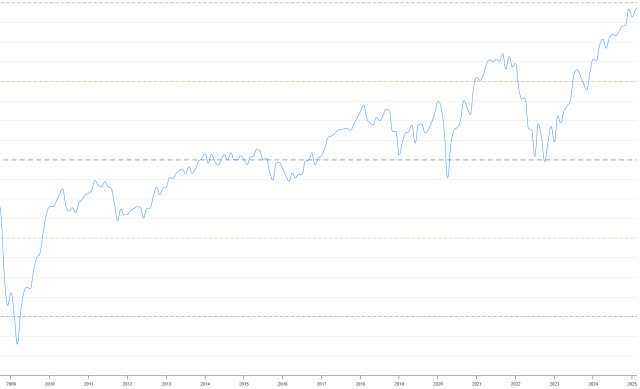
The latest charts from Current Market Valuation have tumbled out, and the story is the same: record highs, record highs, record highs. Here is their aggregate chart, which yet again is at a new peak for this endless bull market. In the entire history of mankind, there was only ONE fleeting moment when the aggregate was higher, and that was March 2000.
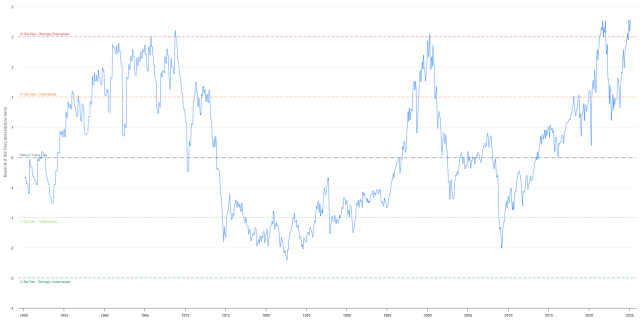
We need make no special mention of a prior higher with the Buffett Indicator, however. It has never been higher. Ever. EVER.
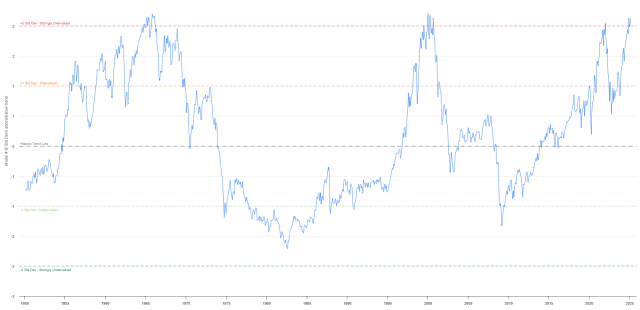
The Reversion to the Mean for the S&P 500 is also above the 2-standard-deviatations mark, which has in all prior instances preceded a total wipeout.
Of course, I’m sure it’s different this time. As the analysts on Wall Street are saying, this is just the beginning. Annual 25% returns for years to come? Absolutely! You deserve it!
