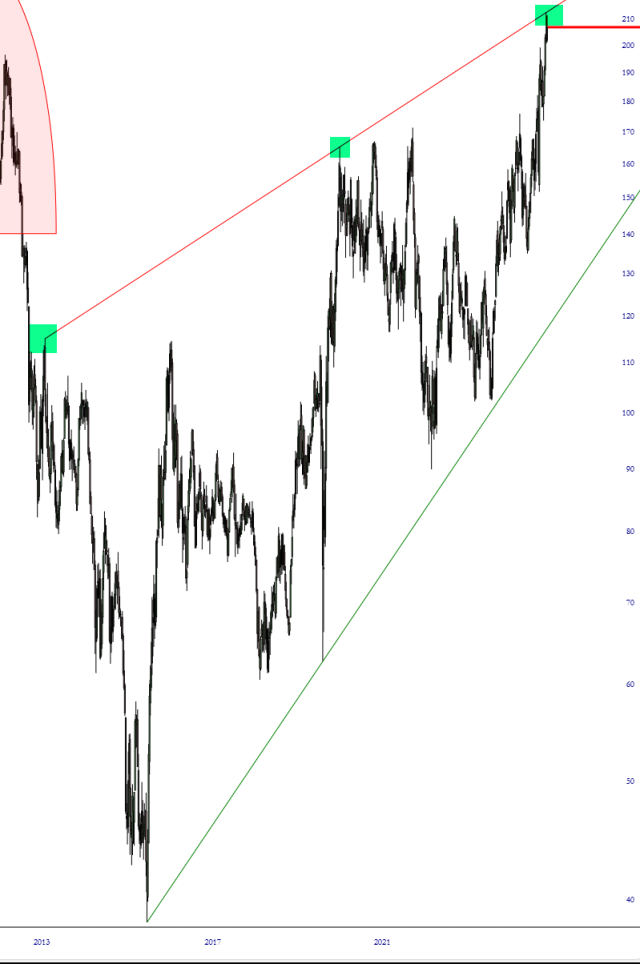
As big a fan as I am of gold and silver, this chart of $XAU – the gold miners index – caught my eye. The tinted portions indicate major points of resistance, measured over many years, and it was compelling enough for me to short GDX.
Slope initially began as a blog, so this is where most of the website’s content resides. Here we have tens of thousands of posts dating back over a decade. These are listed in reverse chronological order. Click on any category icon below to see posts tagged with that particular subject, or click on a word in the category cloud on the right side of the screen for more specific choices.
As big a fan as I am of gold and silver, this chart of $XAU – the gold miners index – caught my eye. The tinted portions indicate major points of resistance, measured over many years, and it was compelling enough for me to short GDX.
We’ve got a modestly red pre-open on our hands. Let’s compare present price levels with what was going on during the Sunday/Monday bull-fest.
Even with the /ES down over 30 points, all we’ve done is rewind to where we were around midnight on Sunday, halfway up its ascent. It helps, but it isn’t even close to a full reversal.


Today was annoying beyond all belief.
In spite of all indications for a down day, we were green all day long and, far worse, the /RTY pushed above the Fib, stopping me out of my options. Welp, that lasted a few minutes, and then back below the Fib we went. I’m glad I have plenty of hair, because otherwise I’d be bald by now from pulling it out.


