
Be Careful You May Burn Your Wings…
Here below is the analysis of the probability of reversal for SPX, NDX and RUT DAILY, photographed yesterday at the close:

Obviously, the RUT and the SPX/NDX are not following the same buy/sell cycles, at the moment.
The RUT is OVERBOUGHT.
Model Setup After Yesterday’s Close:
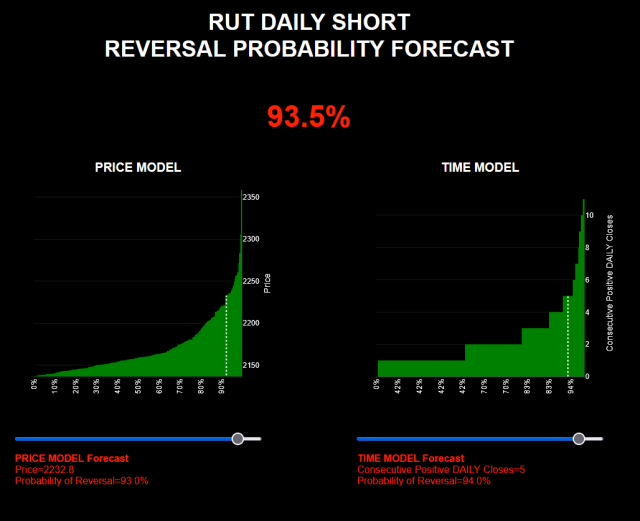
The sliders beneath the histogram have been set to a price level of 2232 (next resistance above the close at 2226) and time = 5 (representing five consecutive up-closes).
Today’s Reversal Probability: 93.5%
This is a strong reversal signal. As always, it’s important to emphasize that this isn’t a crystal ball—rather, it’s a statistical reflection of similar historical patterns. If you examine the price and time models, you’ll notice that in rare cases, rallies have continued beyond this point. Could it happen again? Yes. But historically, the higher the trend stretches, the more difficult a trend continuation becomes (momentum effects do exist, of course—but not every trend continues climbing for 10 consecutive bars. All trends eventually exhaust themselves).
Past patterns keep repeating in history, there is a degree of randomness in the process, but in the end we are all playing with randomness when trading. This model aims to provide a probabilistic framework—helping you assess whether current conditions favor trend continuation or a potential reversal.
If you want to get direct access to these tools, you can use this link.
Use ‘SLOPEOFHOPE’ coupon to get a perpetual 30% discount on the monthly access cost.
