
Long-time readers know that a big problem I’ve got in my investment behavior is the inability to hold on to a good position for the long-term, except in cases where it’s inconvenient or bothersome to sell (such as various rental properties I own, my house, my one venture investment, and a safe deposit box full of gold and silver bullion). If I can sell with just a mouse click, I’m afraid I’ve clicked it WAY too many times in my life. Don’t even get me started!
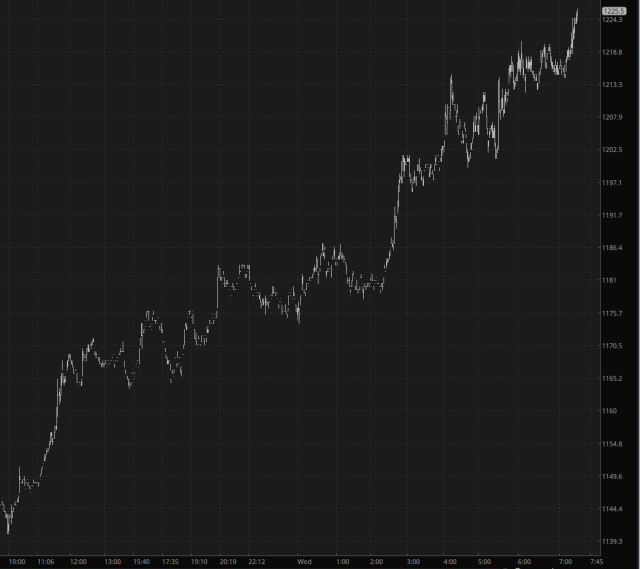
I’m going to try to behave differently with palladium, however, since every ratio chart I look at is screaming BUY and HOLD. One day does not a trend make, but I’ve got to say, this is sailing along nicely so far over the past twenty-four hours.
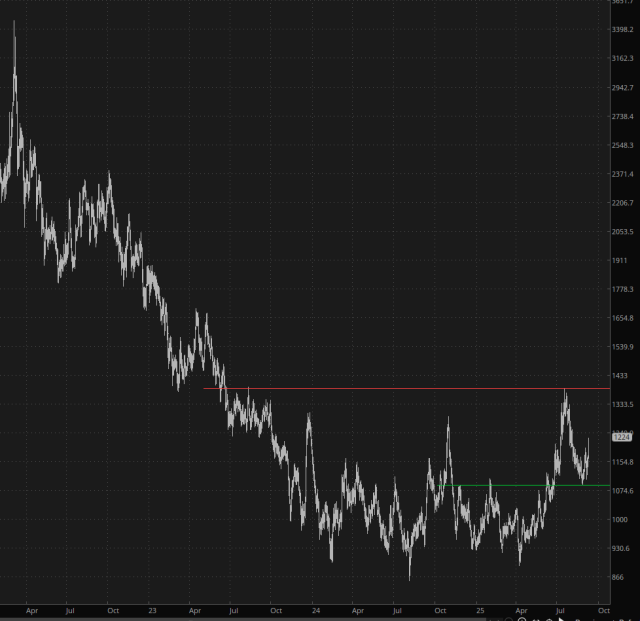
Well, a minute bar chart is all well and good on a strong day, but let’s get real here and look at something more long-term. Below is the daily chart of the /PA, the palladium futures. The bullish base is very well defined. I would argue this is an inverted head and shoulders pattern with a measured move going up to $1917.
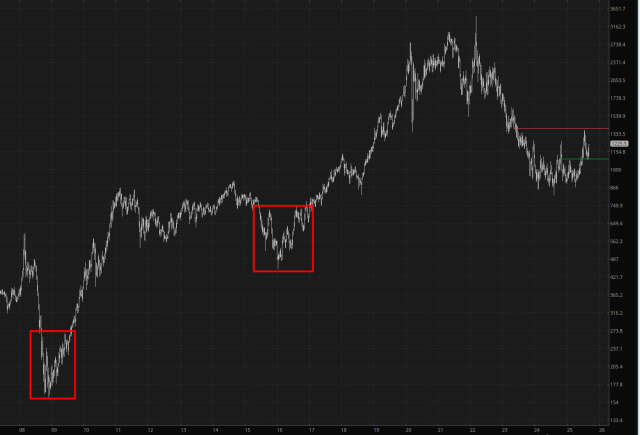
Looking at many years of history, it seems to me that palladium has a solid history of establishing strong bases and then running for an extended period. I would further argue that this most recent base is larger and better formed than its predecessors.
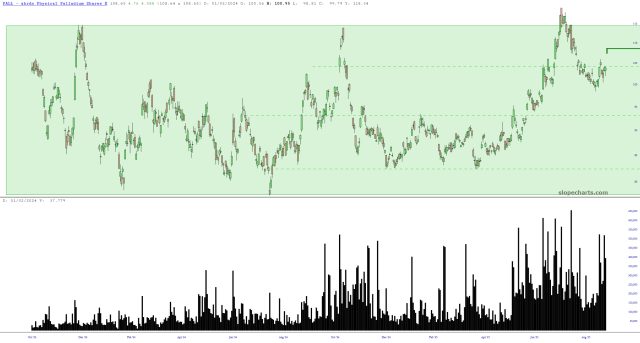
As icing on the cake, interest in palladium, seen by way of the ETF symbol PALL and its volume sub-chart, is quite plainly on the rise.
Thus, I’m going to fight every instinct in my body to hang on to this beast!
