
It was a devilish quarter out there for any surviving equity bears (fittingly, the SPY closed at 666). Let’s go through a dozen charts on a monthly basis (as opposed to the more typical daily) to see what we can see.
We begin with the “diamonds“, the Dow Industrial ETF, which closed at a record high. It has slightly violated its uptrend (anchored to the April 7th bottom) but, as with almost everything else, this is the fifth green monthly candle in a row.

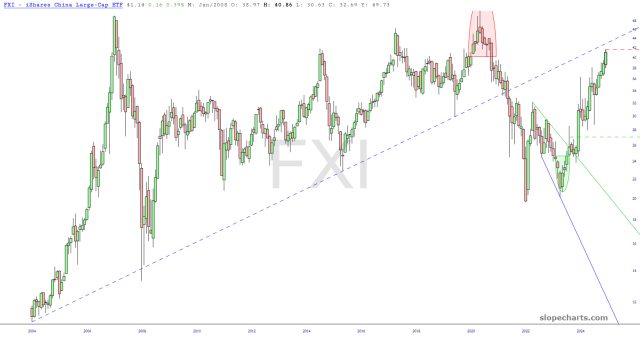
China, by way of FXI, has roared higher, but trouble could be ahead in the form of that long-term broken trendline. That represents meaningful resistance to any meaningful further price gains. There’s only so far BABA can go up, after all.
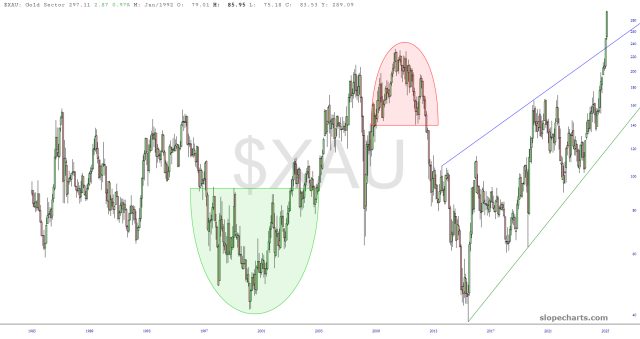
Precious metals, a fixation for Slope since late last year, have been absolutely berserk, as the gold sector index blasted well past its wedge toward lifetime highs. This all by itself should illustrate there are massive changes to the global economic/financial system. Gold, silver, platinum, and palladium aren’t skyrocketing just for the hell of it.
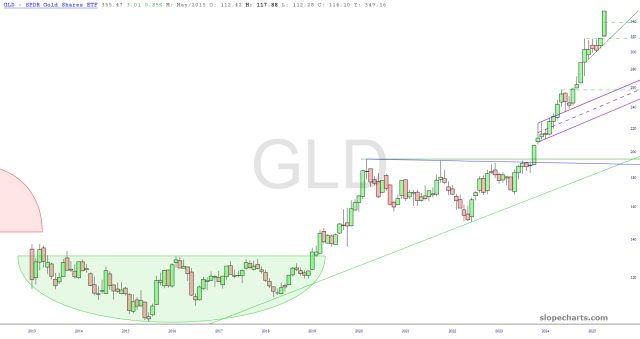
The gold ETF has hammered out two well-formed saucer patterns, each of which have produced powerful ascents. One has to wonder if this most recent rally is ever going to even pause to catch its breath.
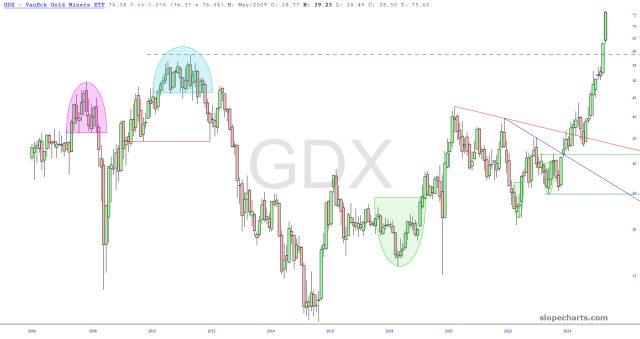
Gold miners have naturally participated in this mega-rally as well. It’s hard to believe that gold itself was only about $200 per ounce back during Clinton’s presidency.
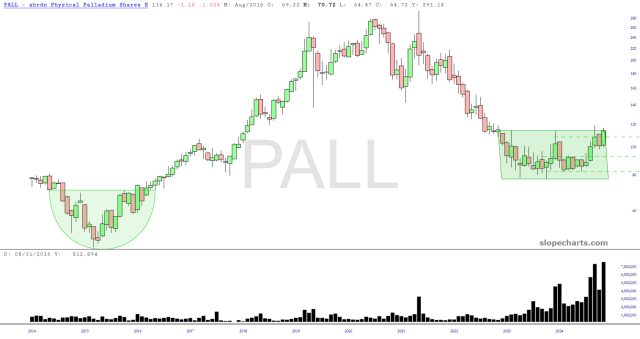
My own personal favorite, palladium, is miles away from highs, but I’m still crazy about it. This is the only chart where I feature the volume, in order to illustrate how much interest has been growing lately. I hate to take full credit for this, but I’m doing what I can!
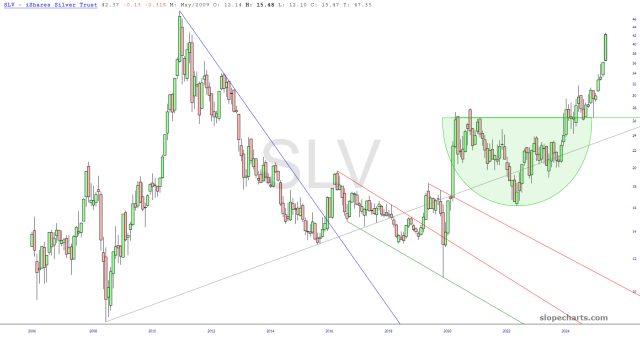
As for silver, it spent many weeks after its breakout doing head-fakes and generally screwing around, but at long last it has finally caught fire as well.
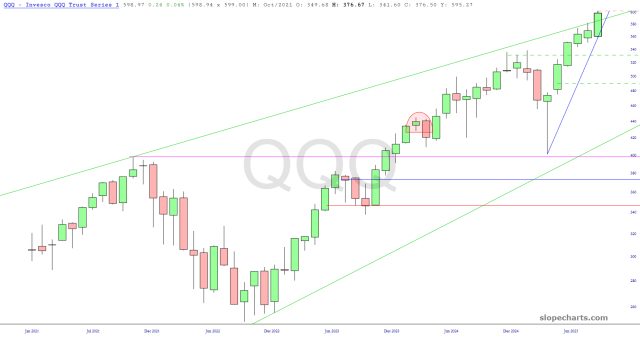
Although gold and silver have beaten the pants off equities this year, tech’s rise continues to amaze. As long as the NVDA/OPENAI/ORCL circle-jerk continues, it’ll just keep floating higher. Break the “virtuous cycle” of AI-related companies handed around the same bag of $100 billion, and you’ll see this entire house of cards come tumbling down.
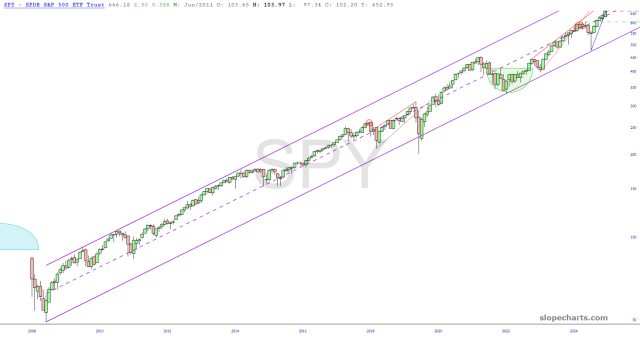
The everything bubble is 200 months old now. It truly is mind boggling. And although several billion events have taken place over the past 16 1/2 years, the uptrend on the SPY is just about as smooth as silk. You could lay a case knife down on the screen, and it would neatly cover the entirety of this chart.
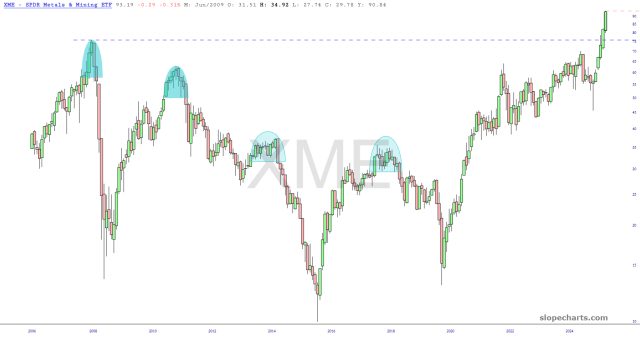
Oh, and one last “metal” item for you, which is the metals & mining ETF. This is a superset of GDX, since it also contains base metals miners, but its surge to lifetime highs has been impressive all the same.
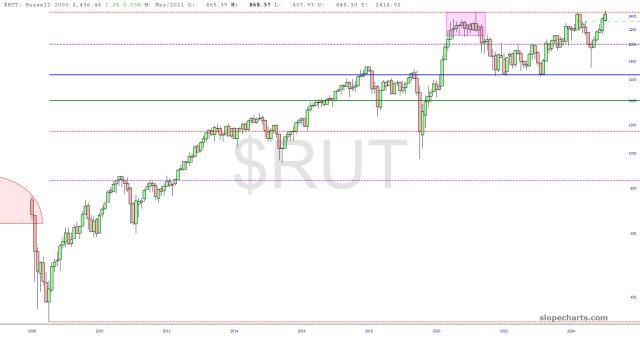
As for the Russell 2000 small caps, the question at hand is a massive one: do the past four years represent:
(a) a well-formed cup-with-saucer pattern that will blast the $RUT to much higher levels, or
(b) a triple top, having reached roughly the same price level in late 2021, late 2024, and now?
Finally, there’s volatility, which itself was about as un-volatile as one could imagine in September.
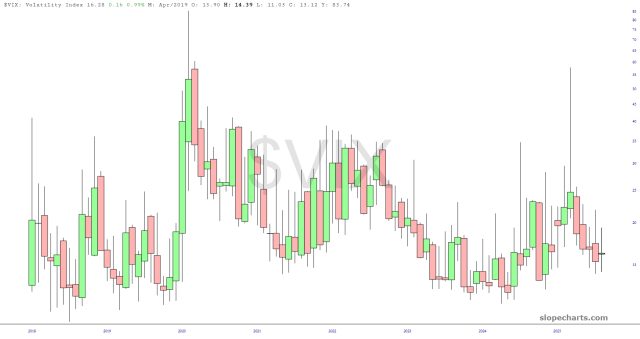
As for both volatility and bearish spirits, one can only say:
Particularly considering September was supposed to be the one and only month of the year that was reliably bearish!
As we entered Q4 2025 (with, evidently, a shuttered federal government), let’s see if anything changes or if it’ll just be more and more of the same.
