
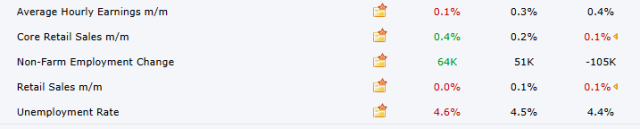
There are just ten trading days in 2025 after today, and this morning kicked off with some important data points. The very-delayed unemployment report showed the unemployment level continuing to rise (which the market considers its “all clear” signal to hack away at interest rates) while earnings were shrinking. It’s amusing that these are in direct contrast to the recent White House “More Jobs/Bigger Paychecks” schtick, but what’s more salient is that the actual unemployment rate is around 27% if you’re not living in fantasy land. Retail sales were also reported, which came in with a white-hot 0% increase.
Regarding our A+++++ economy, here’s the trend for unemployment.
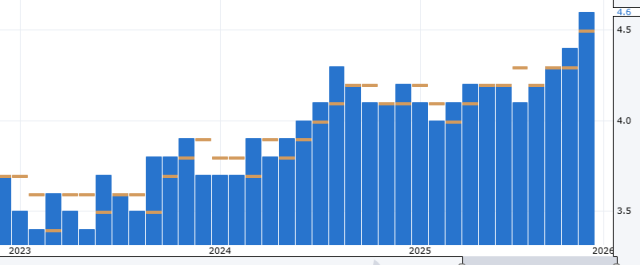
I’ll just say it again, that the true unemployment rate is approaching 30%, but at least the very, very manipulated numbers in the chart above still show the trend.
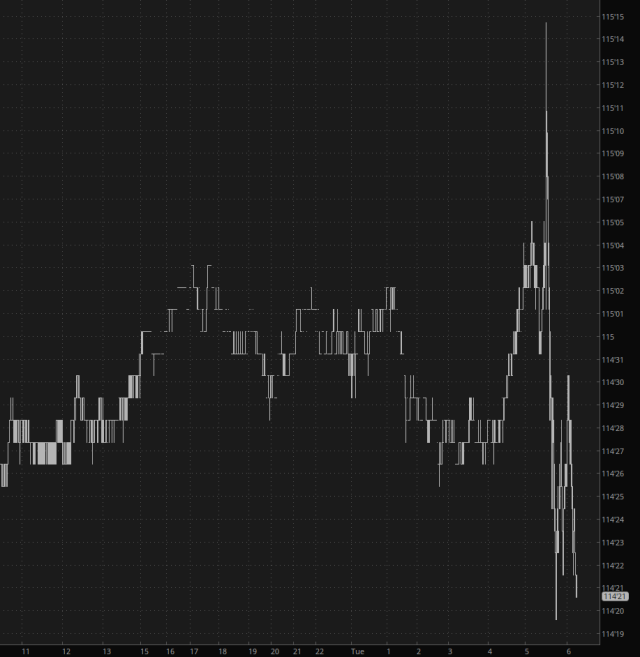
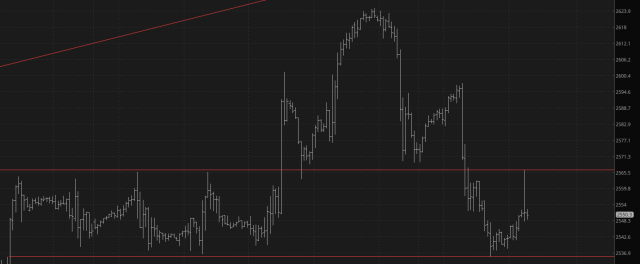
The bond market (which I am short by way of TLT) blasted instantly higher on the data that was issued, but the rally on /ZB futures didn’t last more than a moment.
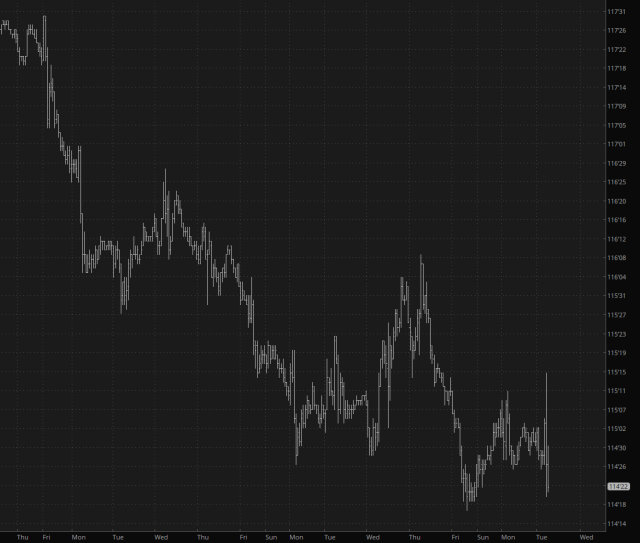
Thus, longer-term, the beat-down continues for bonds.
My favorite chart at the moment is the NASDAQ, since it has the perfect zig-zag downtrend that a child might draw. It also has a very well-formed distribution top.
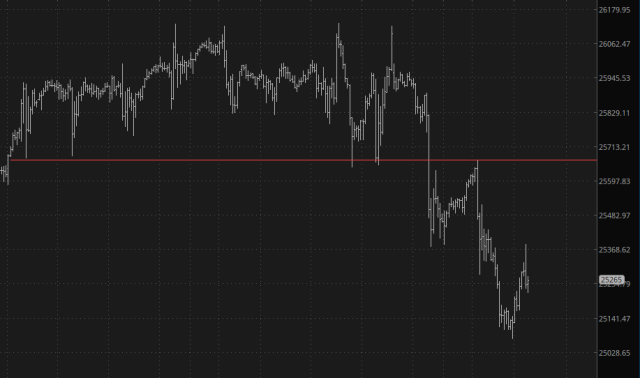
Another quite interesting graph this morning is the /RTY futures. When the economic reports hit, the /RTY ripped higher, but look where it ends: PRECISELY at the neckline! It then slumped back down and has returned to the red. Perfect!
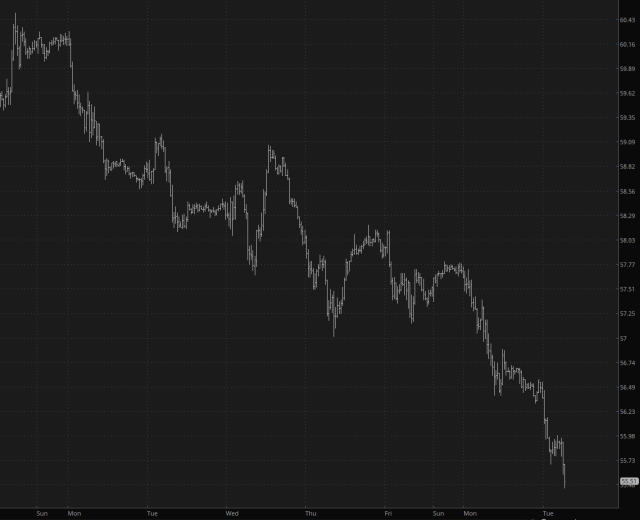
Lastly, the crude oil market, which I consider a far more meaningful crystal ball looking into the global economic future than equities, is continuing to slide.
It’s looking like another good day ahead, so with just moments to go before the opening bell, I’d better click the Publish button. Good luck!
