
This won’t be as long of a post as I usually do since all I’ve basically been watching is Bitcoin. What I’ve been seeing lately is continuing resistance and large drop potential for a couple reasons. First, the headlines are constantly showing some new analyst saying higher and higher ridiculous targets for Bitcoin (at least ridiculous to me).
Some have been less ridiculous, but all have the same common denominator in that the “next bull run is just around the corner”. Well, when I hear that, I look at the chart and ask, “if it’s just around the corner, why isn’t it starting yet?” I am ever the Bitcoin permabear so this line of thinking should not be a surprise. Anyway, key levels which may determine short-term and medium-term direction are both very very close, hence the name of this post.
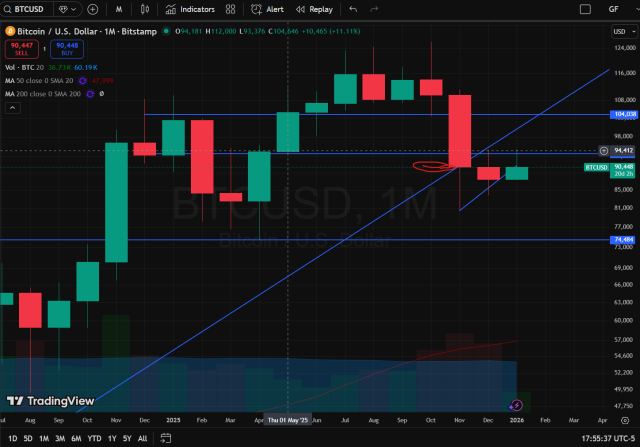
Key levels from 2025 were the year open at 94k (rounding). That area has acted as resistance since the beginning of December and very well I might add. While January is attempting to run up, it also got smacked down and is now fighting with November close/December open around 90,500. This weekend went nowhere and still looks like it can flip downward.
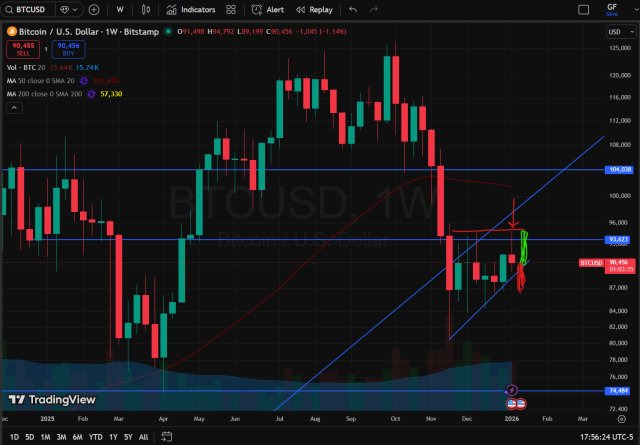
This looks like it can go either way. This next week will be key. The little turn up last week showed great resistance, so point for the bears. But this little fight in this area could only have been a waiting game before this coming week. I could see a big green bar retesting 94k levels (and likely breaking if it does), which would negate short-term bearish expectations. If that happens, I’ll be watching action up around 100k-104k. On the other hand, the supportive short-term ascending trendline sitting around 89k. If that breaks, I’ll watch short-term prior support at 86,500. If/when THAT breaks, I’m aiming for 75k.
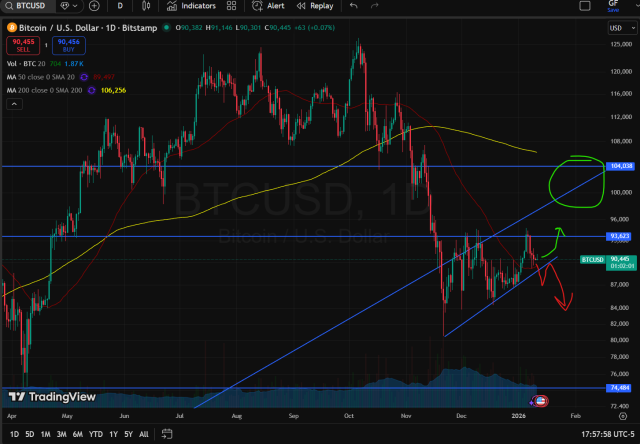
The short-term chart shows the most bullish potential pattern in that this attempted to break upward (again, rejected, so not a clean and terribly bullish signal), pulled back to retest topside of the 50 Day MA and is currently supporting and attempting to bounce further. If this holds, this is the jumping off point for the break above 94k and retest of 100k-104k area where there will be a confluence of Technical resistance, specifically the 200 Day MA, the underside of the large long-term Ascending trendline, and prior support (potentially) turned resistance in October. As I explained above, I’m looking for this to not actually hold and will be continuing my bearish crusade against MSTR and putting in a large red bar this week or the following.
