China Steels Everything!
Slope initially began as a blog, so this is where most of the website’s content resides. Here we have tens of thousands of posts dating back over a decade. These are listed in reverse chronological order. Click on any category icon below to see posts tagged with that particular subject, or click on a word in the category cloud on the right side of the screen for more specific choices.
Well, he did it. Another million bucks. Ah, here, let me explain. When my father passed away, my siblings and I made the brilliant decision to liquidate his entire portfolio and distribute the cash. Out of curiosity, I made a spreadsheet to track what the profits/losses since those liquidation levels would have been had we done nothing. Well, the numbers speak for themselves.
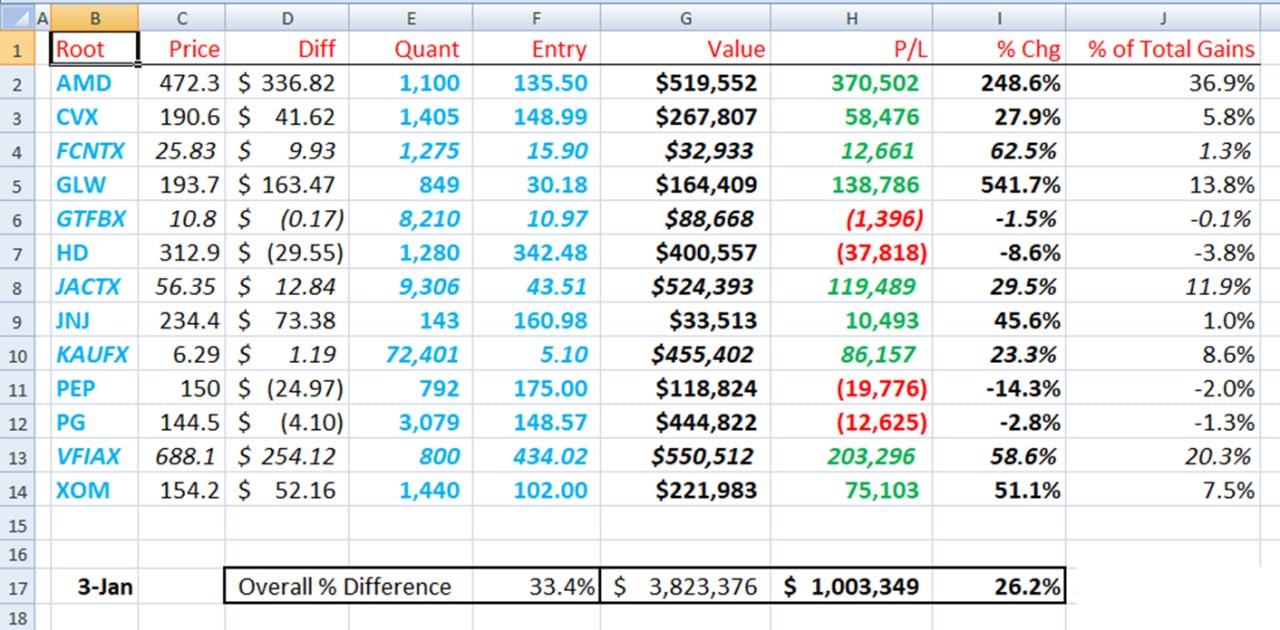
Over a million extra dollars in profits, with the largest percentage gains coming from AMD and GLW. It seems my siblings are just as dumb as I am!
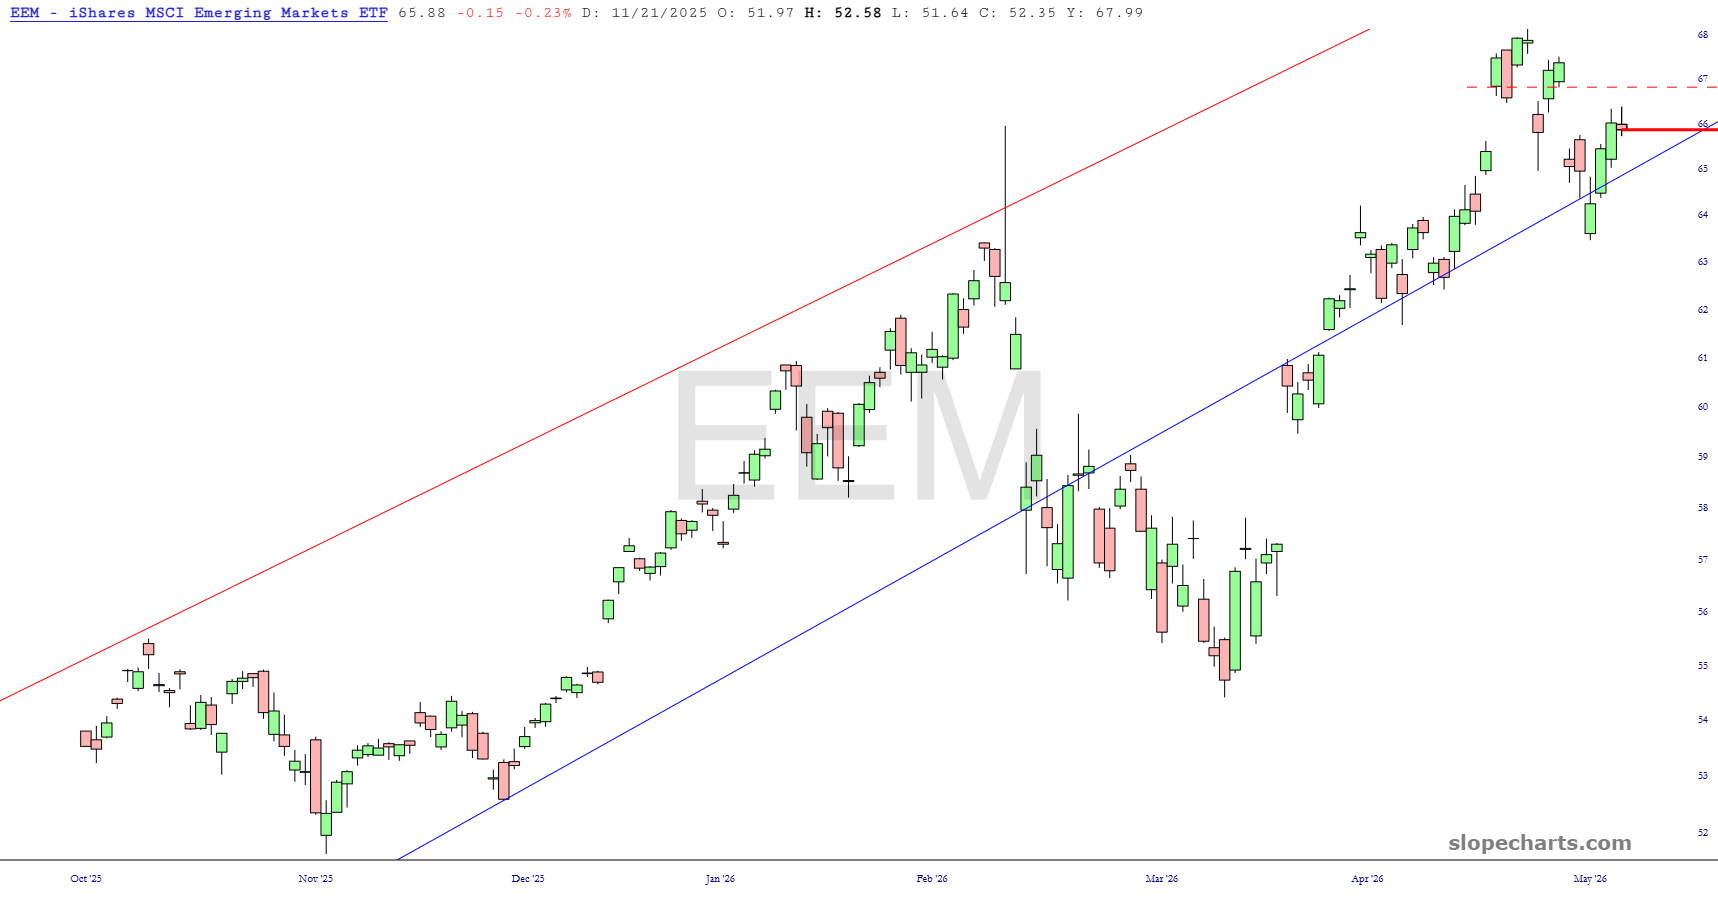
As I mentioned in my previous post, it was surprisingly difficult to find bullish-looking patterns in the wonderful land of exchange traded funds. Bearish patterns were abundant, however. Below are a few.
Emerging markets has broken its ascending price channel and is sporting a very clean price gap.
I’ll level with you: when I created the empty posts for ETFs, one for bullish and one for bearish, I figured I’d be drowning in bullish charts and might not find any bearish ones.
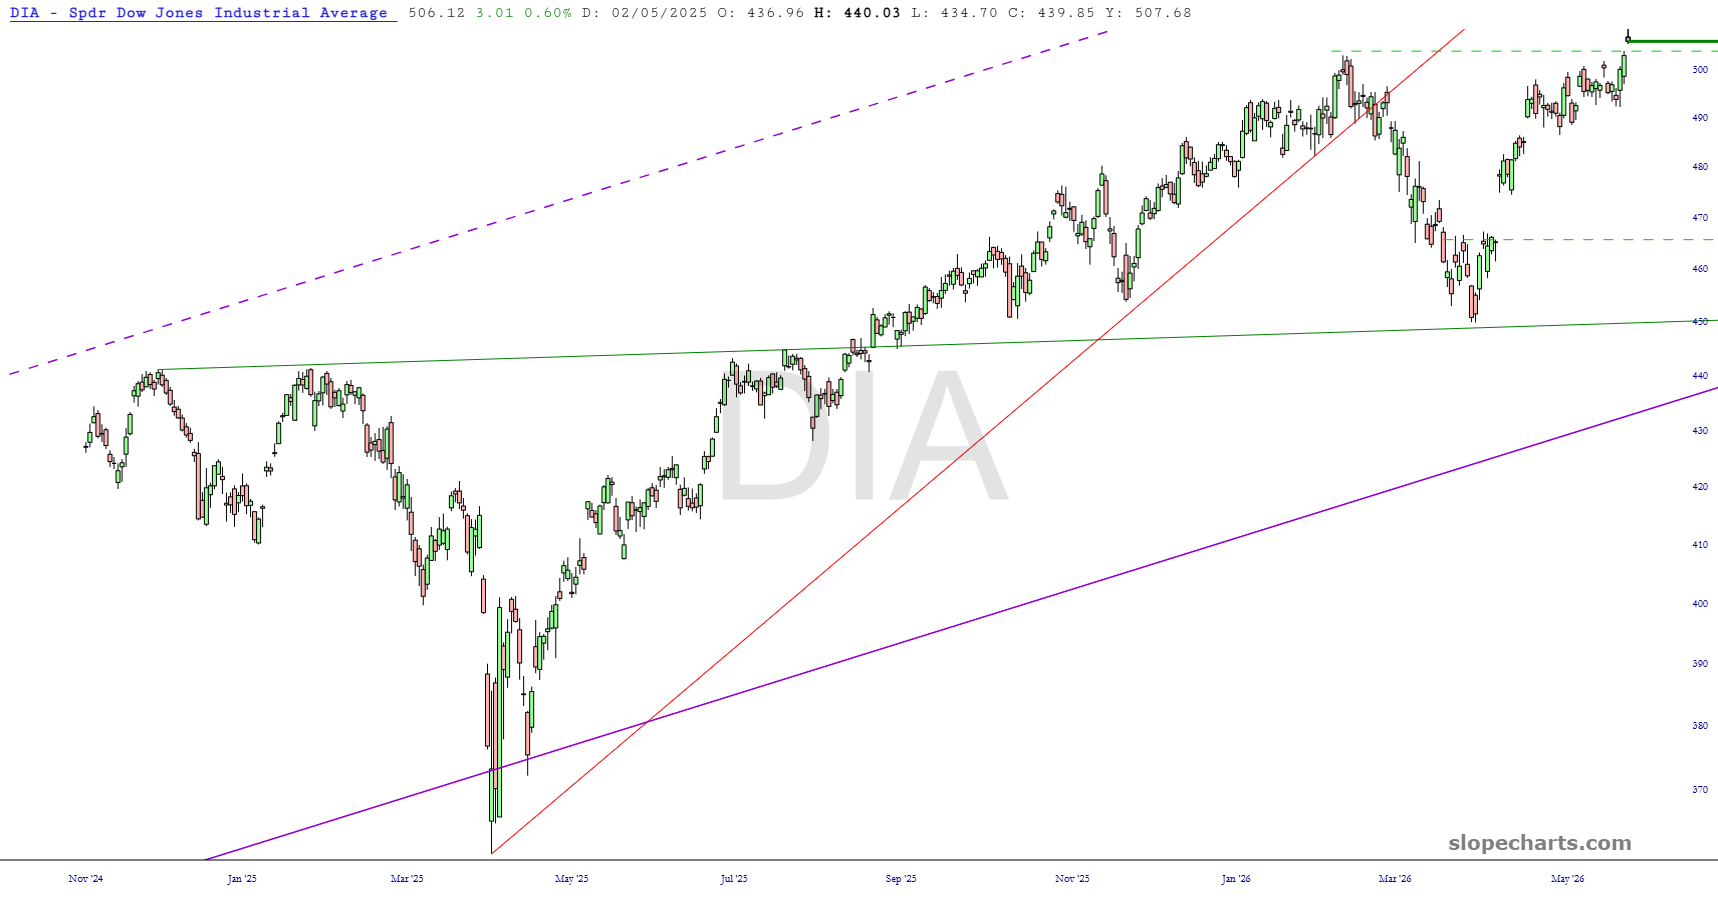
I have the opposite problem. Crazy as it sounds, practically every ETF is bearish (or at least neutral) whereas I was hard-pressed to find anything even remotely bullish. Indeed, there’s one and only one index ETF which I could, with a straight face, say it kinda-sort bullish if you squint your eyes just right.
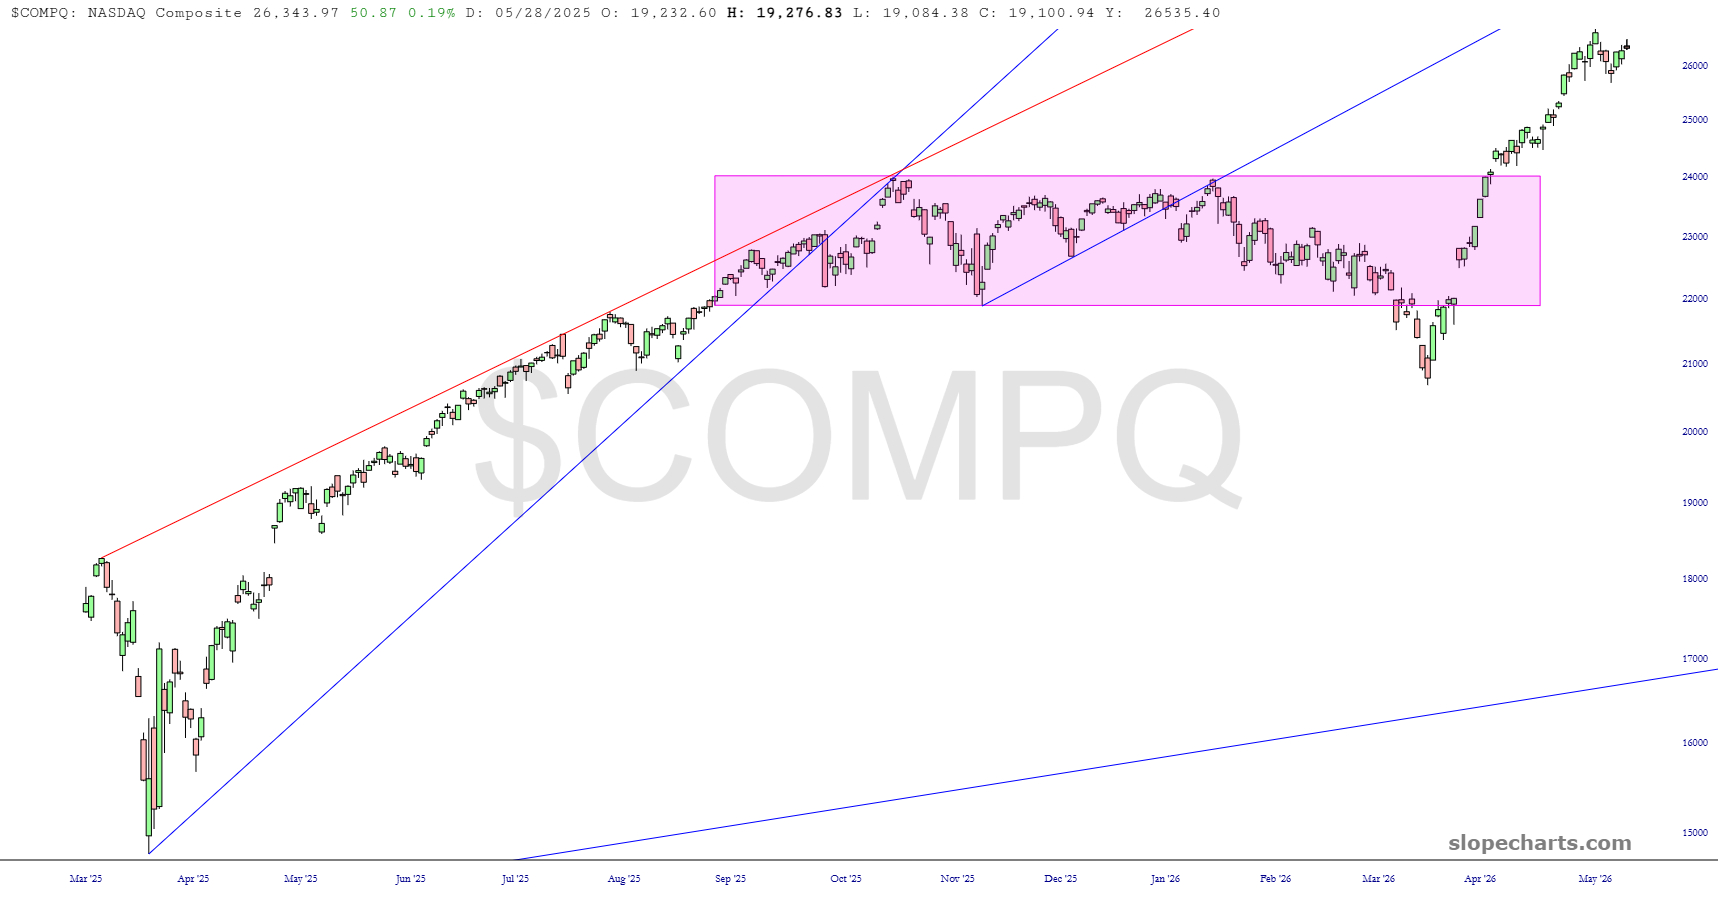
Below are six cash indexes that I find somewhat interesting in this record-high market of ours. First, we have the NASDAQ Composite, which didn’t draw any benefit from Nvidia’s ho-hum performance after earnings this week. This has not achieved new highs, and it continues to be priced for perfection.