
I wrote a post on 23rd April arguing that from an economic point of view the ongoing war between the US, Israel and Iran was largely irrelevant as the only thing that really mattered was how long the Strait of Hormuz would stay closed, and the risk that the Bab al-Mandab Strait might also be closed.
That was almost six weeks ago, and we’ve had a lot of announcements and briefings about peace talks since then, at least some of which appear to have been real, and it looked for a while last week as though there might actually be a chance of an interim agreement, but that has foundered for two strong reasons, firstly that both sides badly wanted a deal they could present as an unambiguous victory for themselves, and secondly that Israel didn’t want any peace agreement, and weren’t willing to restrict their actions in any way to get such any agreement.
On Saturday 23rd May, after a week of talk about active hostilities resuming, as the Polymarket odds of the Strait of Hormuz opening by the end of June fell to 25%, there were announcement that a peace agreement was close, and over the coming week those odds rose and peaked at 59%, and oil fell over 15%. By yesterday morning those odds had fallen back into the 20s and at the time of writing are at 22%. At the high yesterday oil had rallied back 50% of last week’s decline.
Announcements I saw from Iran yesterday included them leaving the negotiations because Israel were not allowing a ceasefire in Lebanon, or observing the ceasefire in Gaza, then Iran cutting off all diplomatic communications with the US, and saying that they were also about to close the Bab al-Mandab Strait for the first time in this conflict. It appears that peace talks have collapsed and will not be easy to resume.
So what now?
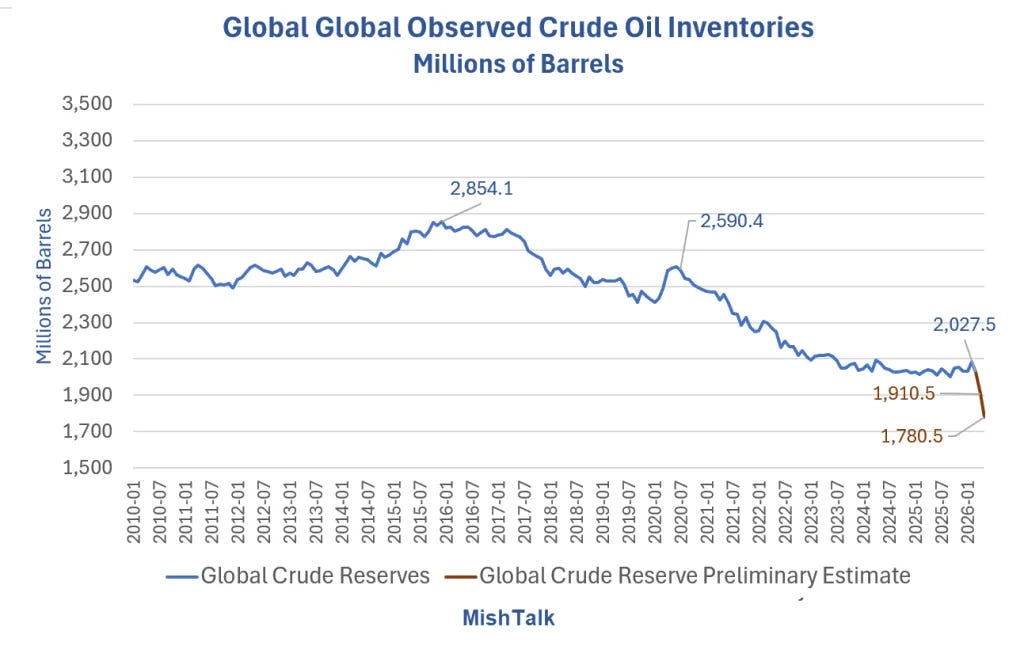
Well as I was saying in my post on 23rd April, the main issue was always whether the Strait of Hormuz stayed closed, and traffic through the Strait has now been at very low levels for over three months.
The consensus view is that oil supply is currently falling short of demand by about 6 million barrels per day, and that has been the case for over three months now. In that time global working and reserve stocks of oil have been declining and Exxon warned last week that these are reaching critical levels, and that within two or three weeks we might see a supply crunch that could see oil prices hit the $150 to $160 area. Chevron agreed and said that June and July would be very difficult months for oil markets.
It is likely that a major supply crunch on oil is coming in June or latest in July and prices would then need to reach a level where enough demand was destroyed to balance demand with this restricted supply. That might of course require prices going a lot higher than $150, and staying there potentially for months.
So what are the charts telling us?
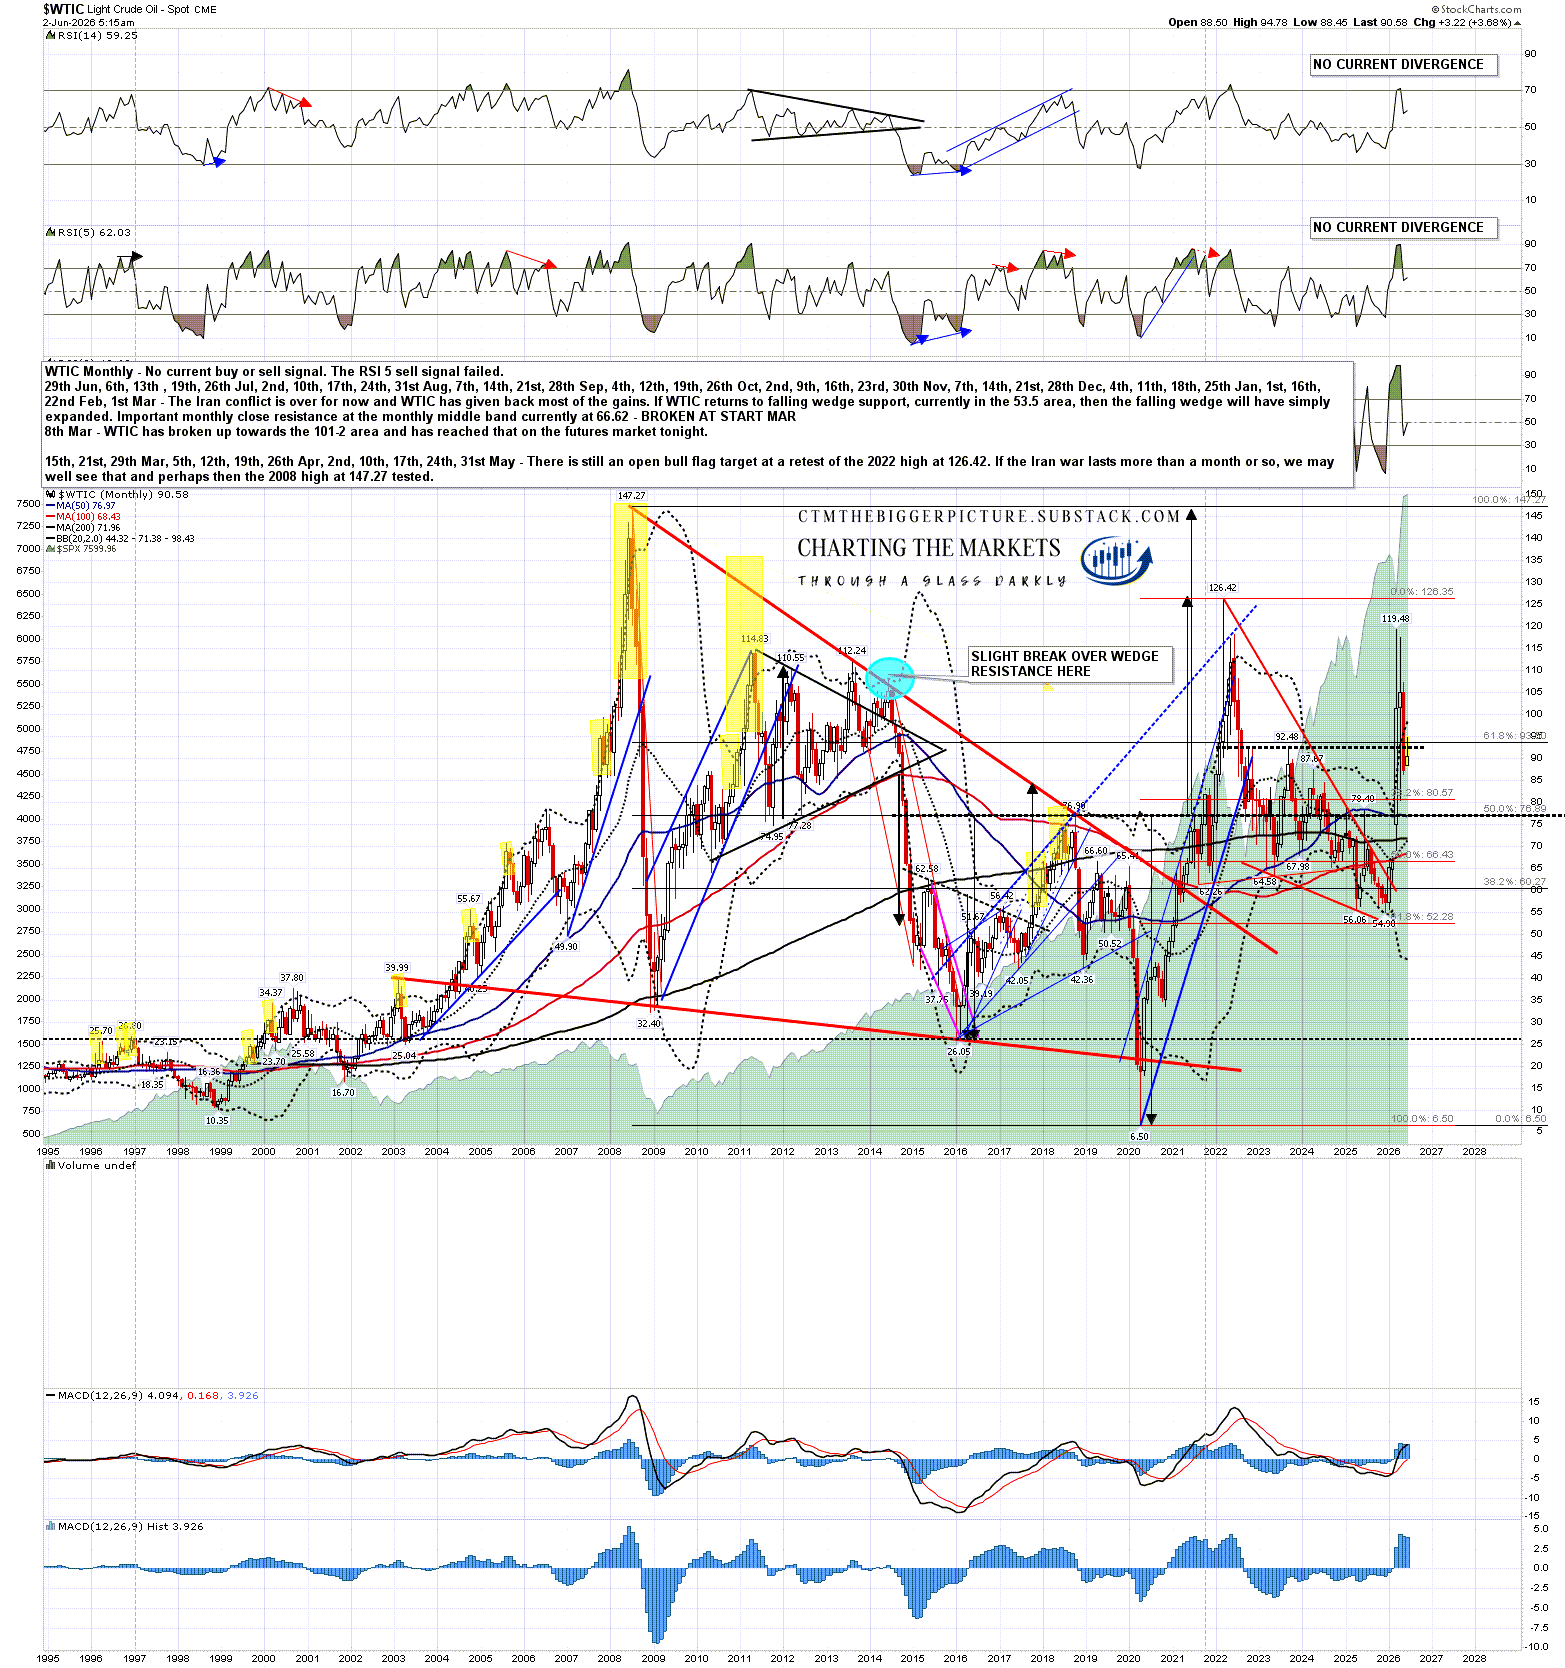
The Brent Crude and Light Crude oil charts are telling similar stories here so I’ll just be looking at the Light Crude (WTIC) charts today.
On the bigger picture WTIC broke up from a falling wedge in February, and from a double bottom at the beginning of March. That made target within a couple of days. That falling wedge was also a decent quality bull flag and that flag has a target at a retest of the 2022 high at 126.42 which has not yet been reached.
There is also an older double bottom from before the 2022 high with an extended target at a retest of the all time high at 147.27. If Exxon and Chevron are right then both of those targets may well be hit in the next few weeks. That would involve WTIC rising $57 in that time from the level at the time of writing.
WTIC monthly chart:
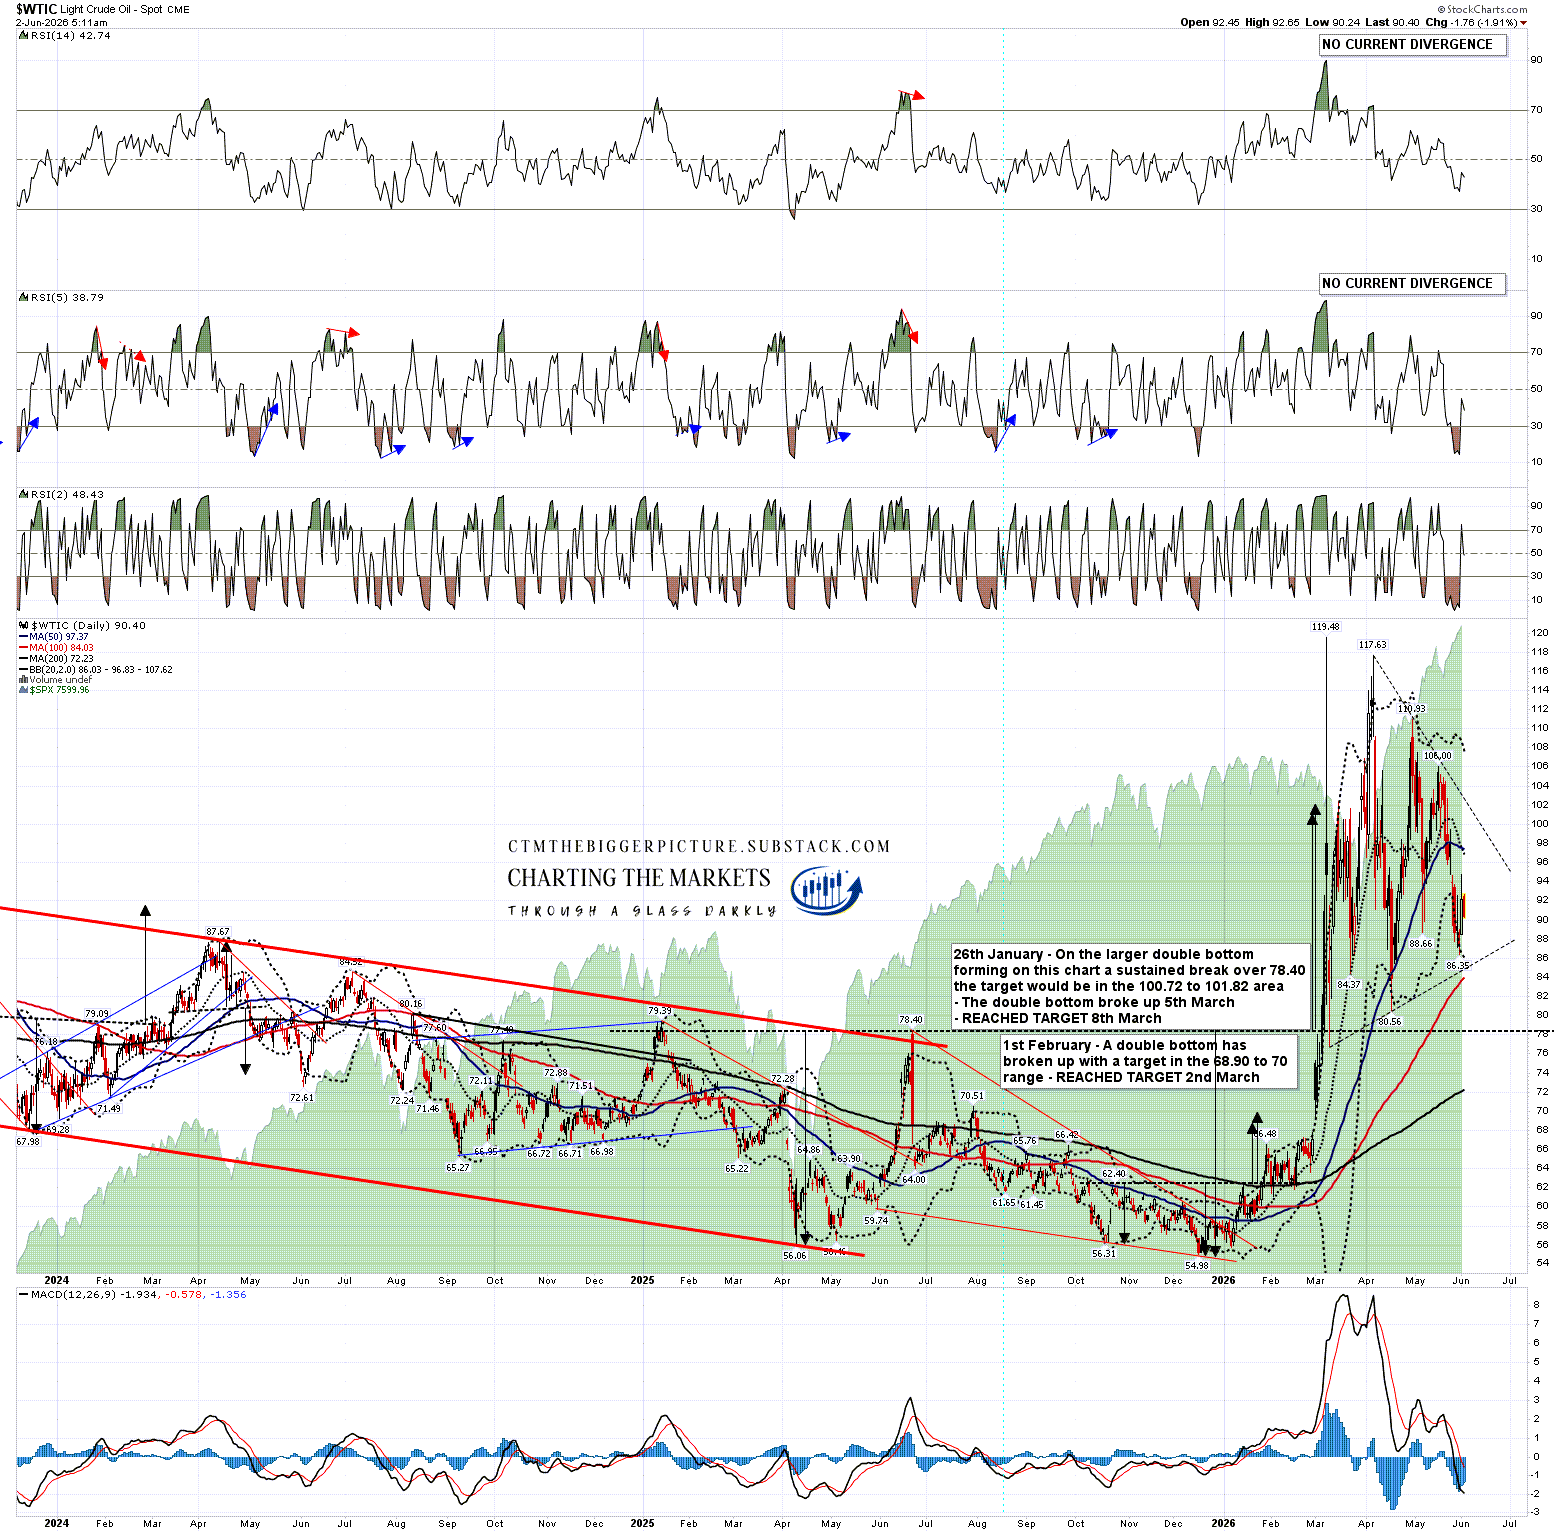
On the daily chart a rough triangle has been forming from the March high and this would generally be a bullish consolidation pattern that should in due course deliver a retest of that March high at 119.48.
If we see last week’s low retested, though that isn’t the obvious scenario here, that should set up positive RSI 5 divergence and set a possible daily buy signal brewing.
WTIC daily chart:
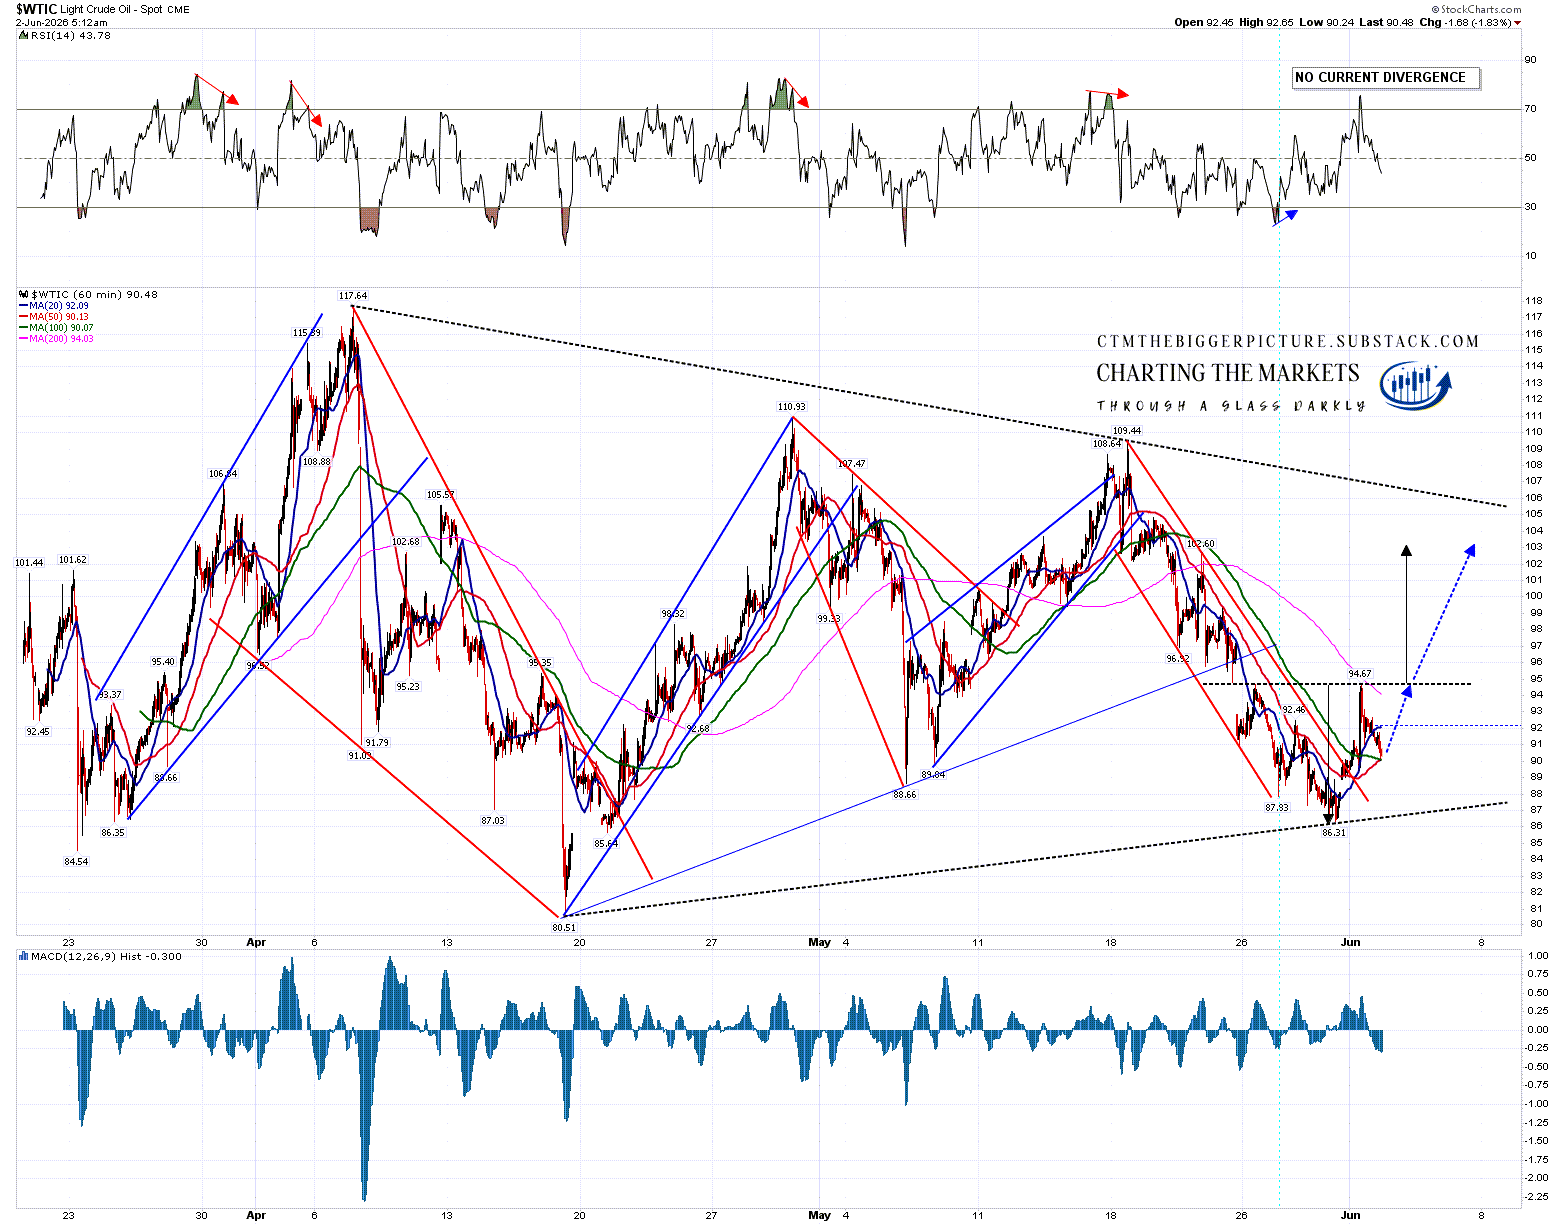
On the hourly chart a falling megaphone from the 109.44 high formed last week and broke up on Sunday. The rally peaked almost exactly at a possible IHS neckline and there may well be an IHS forming here. If so a sustained break back up over the neckline at 94.67 would look for a target in the 103.10 area. That seems an obvious target area with my rough triangle resistance currently in the 106.8 area.
WTIC 60min chart:
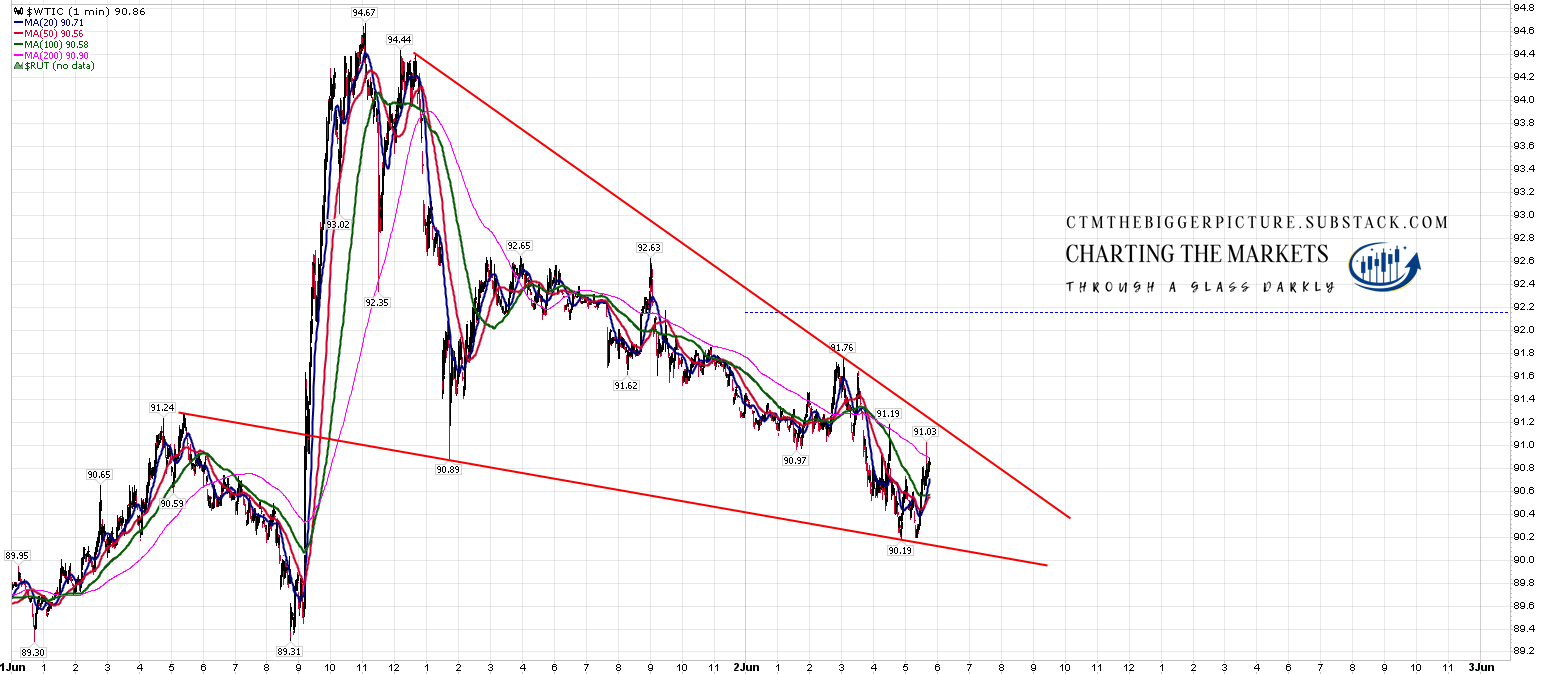
Has the IHS right shoulder bottomed out? Very possibly, as there is an encouragingly high quality falling wedge that has formed on the 1min chart from yesterday’s high. If that holds then the right shoulder low is either made or close. As I have been writing this post this falling wedge has started to break up.
WTIC 1min chart:
Do I think that Brent & WTIC have a real shot at reaching Exxon’s $150 to $160 area? Well the projection I gave weeks ago in the event of a supply crunch was in the $150 to $300 range, so that would be at the low end of my range.
In the event that the Strait of Hormuz magically opened tomorrow I’m thinking we would likely see those new all time highs in any case. I understand that big oil tankers travel at a fast walking pace, so any resumed supply wouldn’t likely be important for a few weeks afterwards in any case.
The oil long from here has potential to be the trade of the year in my view.
If you like my analysis and would like to see more, please take a free subscription at my thebiggerpicture substack, where I publish these posts first and for members (from next week) also bi-weekly videos looking at equity indices, bonds, currencies and commodities. Those videos are posted on my Youtube channel after a seven day delay. Links to all my posts from my charting substacks are also always posted on my twitter.
