
I posted the SPX chart below in my MarketShadows post at the weekend and I'll post it again this morning. You can see that full post here. It shows the very ambiguous close on Friday at the retest of broken support and at resistance on the declining channel from the high. I sketched in two topping options if we see a break up from there this morning, and they are that SPX has made the first high and valley low of a double or M top, or that SPX has put in the left shoulder of an H&S pattern. Either of those would obviously allow the current high to be tested or exceeded:

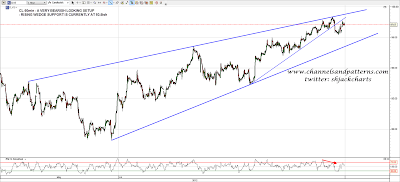
As you can see on the ES chart below, declining resistance there has already been broken overnight and that's looking bullish for today so far: The same options apply there:

As I said on Friday morning the low on Thursday was a textbook bounce at the middle bollinger band (or 20 DMA) on the daily chart:
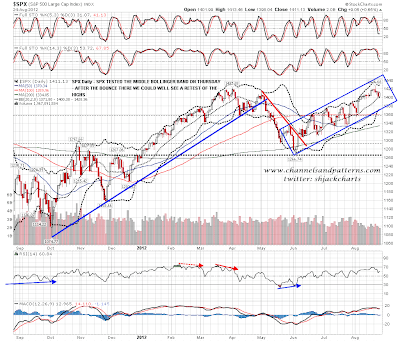
In my view the odds favor SPX having at least started the topping process for the next swing high, but we often see a sharp retrace at the start of that process, and as long as SPX is holding that middle bollinger band the top technical candidate for that next swing high is at the test of the 1440 area SPX pivot.
Looking at other markets the bearish rising wedges on oil and EURUSD are obviously looking very promising for a more significant decline on those soon. On CL the chart is at a stage where all of the trendline chartists will already have left the long side for the moment, having hit the top of the wedge and then broken rising support from late July. Wedge support is now in the 93.5 area and I'd be expecting a move towards that soon, though we could see a sideways move towards that trendline above 95.3 support
EURUSD looks similar to oil, though there is a W bottom look to the recent action and we might see a retest of the highs on a break above short term declining resistance to make a double or M top:

Silver has broken slightly above declining resistance from the high and my view is that the retracements from the 2011 highs on both silver and gold are most likely over. RSI is rather overbought on the 60min though and we could see a retracement before the next move up:

I've been posting a lot of bonds charts in recent days, considering carefully whether a major high may have been made. You can see my very long term chart of TYX in my weekend post, looking at the bottoming options on 30 year treasury yields. Here is another very long term chart, this time looking directly at USB, 30 year treasuries. The channel isn't as perfect as the one on TYX, but it's good, and is suggesting a reversal at major trendline resistance from 1980:

I think a swing high on SPX is close, and it may be a very major high,depending mainly on whether rising channel support on SPX can be broken on the next swing down. Topping is a process though, and often the first spike down just signals that the topping process has started. I've shown before how major swing highs on SPX tend to be made at major resistance levels, and the obvious candidate for that is the 1440 area SPX pivot and the rising resistance trendline just above that I showed in my last chart on my weekend post. Declining resistance has broken on ES overnight and we may well see a test of the highs today or tomorrow.
