
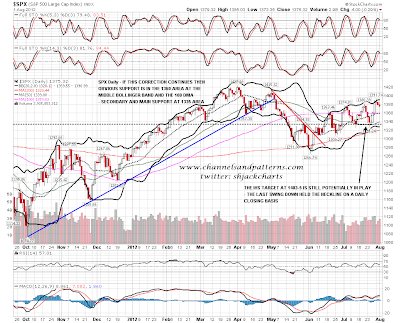
SPX closed down yesterday for the third day this week and we have a series of short term lower highs and lows, so as long as that lasts we are in a short term downtrend. On the SPX daily chart first decent support is still in the 1360 area at the middle bollinger band and 100 DMA, and secondary and main support is still in the 1335 SPX area if that breaks:
On the SPX 15min chart yesterday's pennant or falling wedge from the high has been replaced by a larger declining channel. Obviously this may still be a bull flag and SPX needs to break below channel/flag support to kill that off. I have declining resistance in the 1381-2 area and a break over there would look bullish, and a higher short term high over 1385.03 even more so:
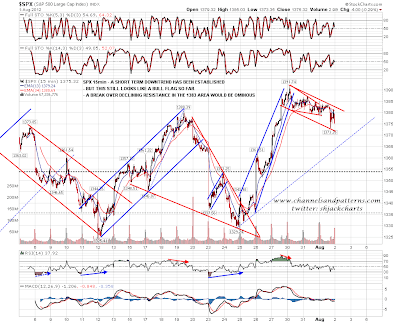
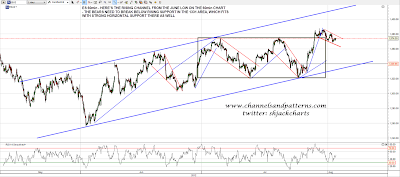
I've mentioned the rising channel from the June low on SPX. There's another on ES and that's going to look guardedly bullish overall until it breaks down. There is another declining channel cum falling wedge setup on ES that may again be a bull flag. Main channel support on ES is in the 1331 area which fits with strong horizontal support in the 1335 area on SPX. Bears need to break below this to confirm any downtrend is for real. There is some positive RSI divergence on this chart which is worth noting:
I posted a small H&S on GBPUSD on Tuesday and that followed through nicely. The 60min RSI now looks oversold and GBPUSD is close to an obvious support level at rising support from mid-July. Ideally there would be a move down to there on positive divergence before the next reversal up. Unless support breaks this is likely to bottom out in the next day or two and reverse back up, and if so that would look bearish for USD and cautiously bullish for equities:

Gold reversed back down again yesterday and is retesting broken triangle resistance. Ideally that should hold. If it doesn't it opens the real possibility that the break up from the triangle was a false break before a strong move in the other direction. That happens a lot on triangles which makes them tricky to trade:

Overall I'm cautiously bearish today but is SPX gets to 1385 I'll be expecting a test of the highs at minimum and I measure the flag target to the 1410 area on ES and it's worth noting that rising channel resistance is in the 1411 area at the moment. At the time of writing ES is testing the upper trendline of the little declining channel or flag from Monday's high.
