
Just as the Super Bowl was a dud to watch (sorry Patriots fans, that game was terrible), this upcoming week may bring a dud for bulls in Apple ($AAPL).
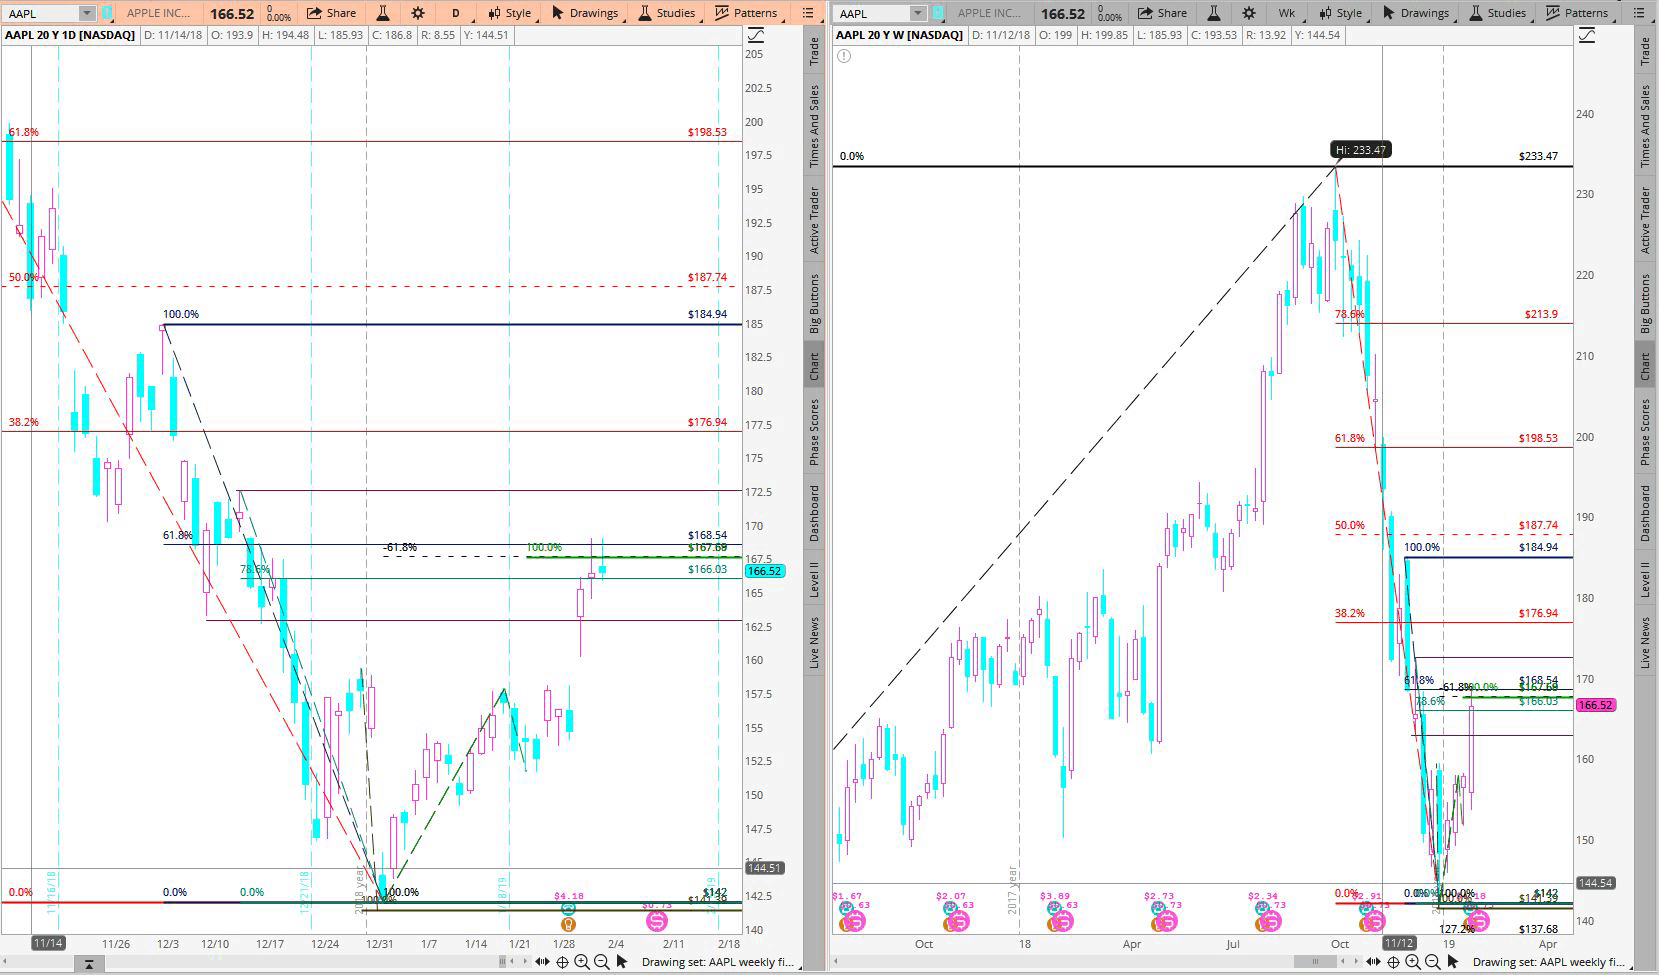
Note on AAPL’s daily chart that price ran into a key fibonacci price cluster within a prior pullback zone and stalled after its earnings gap up.
That cluster is made up from:
- Purple line: A symmetrical price target 1-to-1 projection using the distance from the January 3rd low ($142) to the January 18th high ($157.88), and adding that distance to the low from January 23rd ($151.70)
- White line: A 1.618 fibonacci extension level from that same January 3rd low ($142) to the January 18th high ($157.88)
- Pink Line: 78.6% fibonacci retracement of the bear impulse down from the December 13th high ($172.57) to the January 3rd low ($142)
- Gold line: A 61.8% retracement of the bear impulse down from the December 3rd high ($184.94) to the January 3rd low ($142)
This four-fib cluster appears about half-way within a prior pullback price zone on the daily chart. That zone (two light green lines) is made from the low put in on December 10th ($163.33) and the high on December 13th ($172.57).
Noted $AAPL trader Micah Lamar also noted in his weekend video that Apple is nearing the average length of its heiken-ashi cycle of seven trading days. Monday would mark day seven.
Target #1 for any pullback would be to fill the earnings gap. However the statistics for such a gap fill are not good for this week.
Using the options strategy backtester at CMLviz.com (which TK partnered with to hold a webinar last week), we find not only one reason to be bullish of AAPL post-earnings, but two reasons for at least the two calendar weeks following an earnings gap up of 3% or greater to see bullish pressure.
And as Dutch has pointed out multiple times during the past week, February is historically AAPL’s most bullish month of the year.
From all of this evidence, what’s more likely is a pause and perhaps small pullback to see if the bulls can pick-up a bit more of AAPL at a lower price, then an attempt to take price higher on the weekly chart, where’s there’s no real point of decision until the 38.2% retracement from the all-time high at $176.94.
This “blah” week thesis fails on a daily break and close above the fib cluster zone top of $168.54.
