
Whichever way you cut it the chart setup for equities here looks bearish. SPX still hasn't broken below 1340 support but the repeated failures at the broken H&S neckline last week look very ominous. There are in fact two bear patterns in play here. The first is the sloping H&S indicating to the 1290 area that I've been posting every day. the second is a double-top on the April and May highs, that indicates to 1292. Given that 1292 was also the October high and an important support level, on a conviction break below 1340 the obvious target has to be a test of 1292 SPX:

On NQ the action over the last three days has the look of a bear flag. I have a provisional declining channel on NQ, and on a conviction break below the 2585 support area my next target would be under 2500

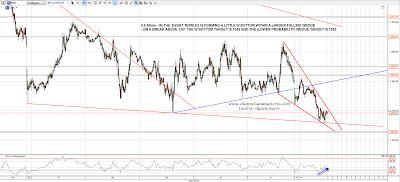
On EURUSD the positive divergence I've been noting on the 60min RSI over the last three days has failed to deliver a bounce, and we may well see a hit of the H&S target in the 1.27 area before we see one:

If we do see a support break on SPX then the subsequent move downwards may well be fast. The IHS that has formed on Vix is suggesting a fast move to the 28.5 area there on a break:

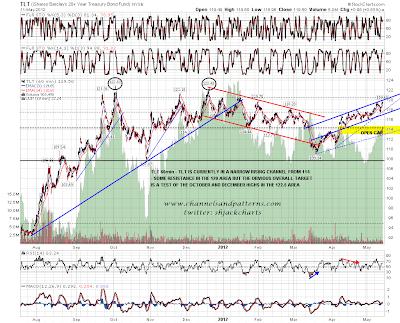
I've been looking carefully at the TLT chart, where the obvious target for this move up is a test of the October and December highs in the 122.5 area, with some resistance in the 120 area. I have a small rising channel in play there at the moment:
For today I'm watching a pattern on the ES 15min that might deliver another attempt at the sloping H&S neckline on SPX. That is a very nice looking falling wedge, with a small W bottom within it. Assuming that Es doesn't go below the overnight low at 1335.75, a break above 1341 delivers a W bottom target at 1346 and the (lower probability) falling wedge target is at 1363:
At this stage we have to take a test of the October high at 1292 SPX very seriously, and on a break below we might well be looking at a much larger bearish setup. I've posted a few of these bigger picture bearish charts in the last few days and here is the updated EEM chart, showing the potential H&S there that I've been posting since before the October low. You can see that EEM broke initial support last week and the next target is rising support from the 2009 low. On a break below that the obvious target is then a test of the October lows to complete this very large H&S indicating to slightly above the 2009 lows. Worth bearing in mind:

I'm leaning bearish overall and am expecting the H&S neckline on SPX to hold as resistance. While it does hold the bulls have nothing to cheer them here and the next significant move is likely to be downwards. Short term that falling wedge on the ES 15min is suggesting that we might see a decent bounce today on a break over 1341 ES. I have wedge support currently in the 1334 area.
