In recent weeks, I have become increasingly disenchanted with common stocks as a vehicle for shorting. That is not to say I’m not shorting them – far from it – but I have decided to strike out for more temperate, less shark-infested waters, and have been keeping my eyes open for good charts in other financial realms.
Interest rates were not typically something which grabbed me, but the more I looked at long-term trends, the more interested I became. The bond market had, of course, been in a very strong bull market for years on end, and the arguments on either side were both pretty convincing. However, with the #1 buyer of bonds (his name rhymes with Fur Wanky) beginning to step away from the sales counter, bonds have been breaking down.
I read an article a couple of months back about how bond markets break down in stages, and those stages are dictated by quality. First the junk bonds start to break; then the municipal bonds, and finally, the “blue chip” realm of U.S. Treasuries. So I started looking at all three of these areas.
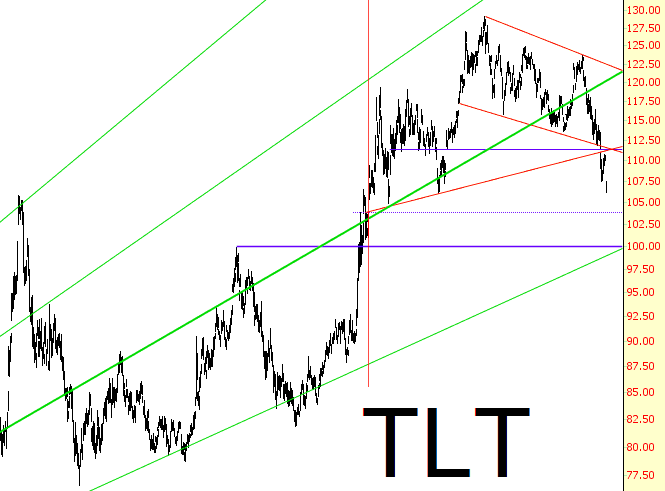
As I started to focus on U.S. bonds (by way of symbol TLT), some remarkably simple patterns came to light. On the first of this month, I wrote this particular post, which has a chart I considered a thing of great beauty. Now that a few days have gone by, we can see how my conjecture that the intersecting lines “…provides a strong pivot point to repel prices downward” was, I am pleased to say, correct.
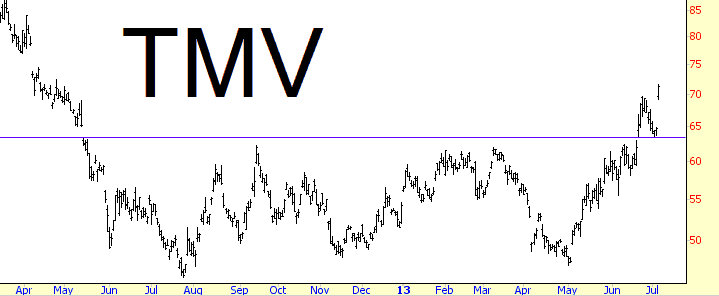
I was egged on by the fact that leveraged bearish instruments related to bonds, such as TBT and TMV, looked like fantastic buys. The chart below, for instance, is the triple-bearish bond fund. If someone showed you the chart without the symbol, I suspect you’d be very interested in buying it (at least before Friday’s price spike), since it’s a gorgeous pattern.
Thus, at the market’s closed on Wednesday, TLT was by far my biggest short, and I also – in my options account – had a bunch of July $112 put options. The fact that they had a July expiration speaks to my confidence in the trade, because I tend to be very conservative about time decay. I usually buy options that are months away from expiration. So although Friday was not a great day for me, my options account did fantastic, and the damage to my big portfolio was muted by my interest-sensitive shorts.
Although I cheerfully sold my TLT puts, I held on to – – and augmented, in fact – – my JNK puts, which have an expiration in September. I think this chart is exciting.
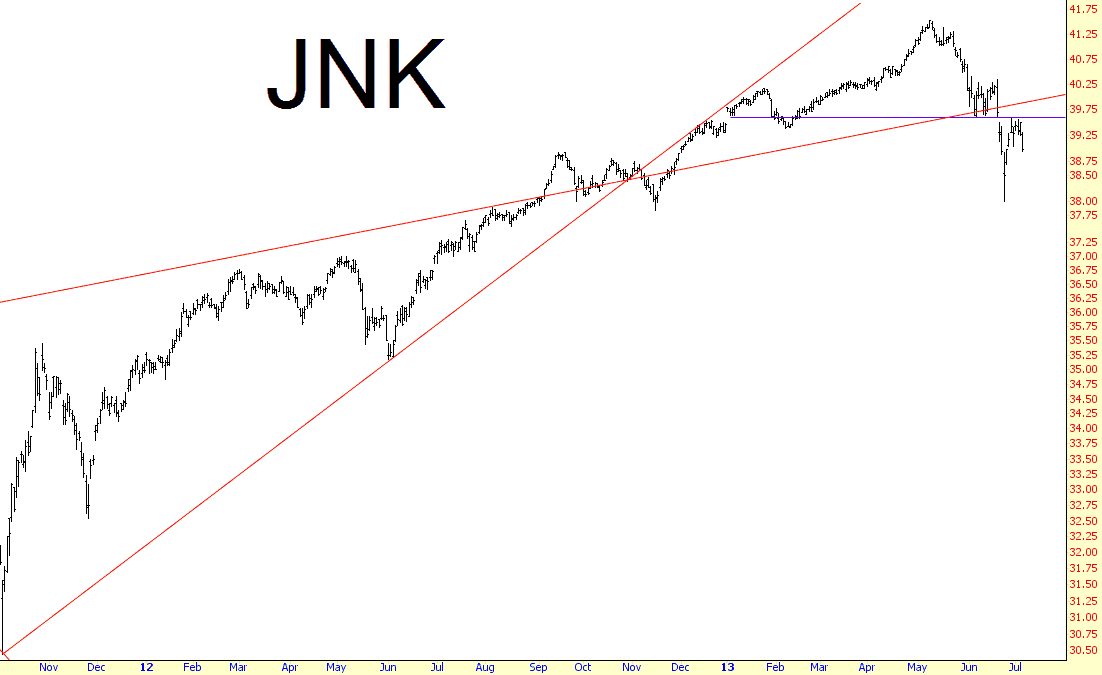
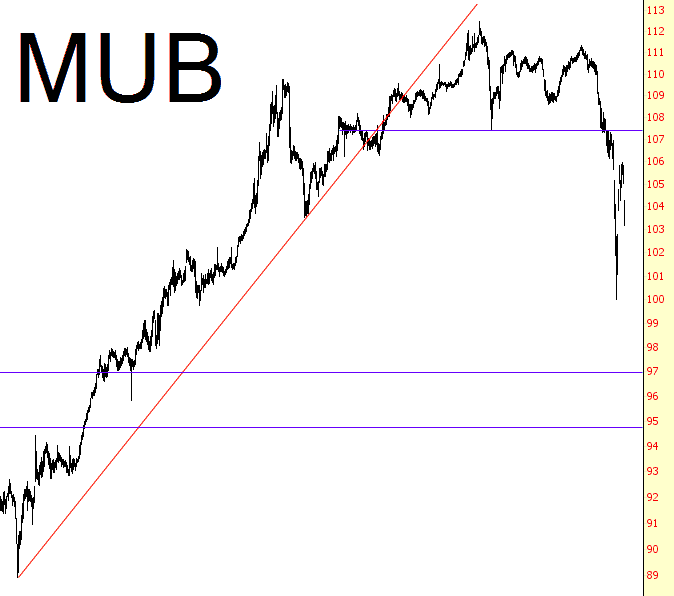
I like municipal bonds on the short side, too, but between JNK and MUB, I prefer the former. There is a lot of room to fall, and let’s face it, the finances of most cities are in pretty serious trouble (Palo Alto notwithstanding, as their biggest problem these days is how to wisely spend the tens of millions of extra dollars they’ve got……….a nice problem to have!)
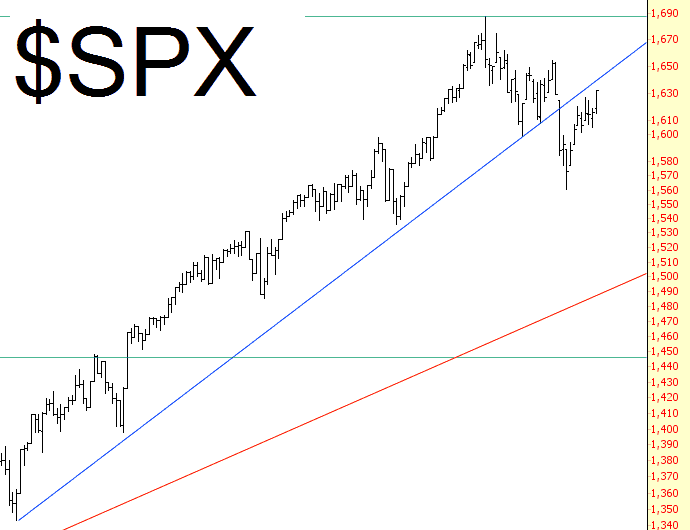
As for common stocks, I certainly haven’t lost faith in the bear case, in spite of Friday’s strength. I make no secret of my disappointment about Friday. An hour into the trading day, I was practically doing handsprings, because bonds and stocks were falling together, and stocks had lost all of their “Draghi” and “jobs report” spikes. However, this weakness gave way to strength, and the Russell 2000 closed at its highest level in human history. With interest rates skyrocketing, I find this perplexing and disturbing, because we can just add another major macroeconomic item on the list of Things The Market No Longer Cares About.
We are still below an important broken trendline, and the gaps we had from our two day Great Bear Market of 2013 have been filled. Who knows – – with earnings season kicking in a couple of weeks from now, maybe people will finally find a reason to sell. For myself, I’m keeping my big bets over in interest-rate-land. It seems to be kinder to the ursine set.