
The stats for today are strong as I noted in my weekend post which you can see here. Against that the technical picture looks unambiguously bearish, and I'm expecting more downside this week, though not necessarily today. I'll repost the SPX chart I posted at the weekend below, and that is the SPX 15min chart showing the rally last week as a bear flag with a target at 1312. I was asked at the weekend where I found the stat that 47% of such breakdowns could be expected to reach target, and that was from Bulkowski's site and the relevant page is here:

On the ES chart there is now a decent declining channel from the high. Channel resistance is at 1383 and channel support is at 1339. There has been a bounce up overnight on positive 15min RSI divergence and that has failed at 1371.50 area resistance so far:

There is also a decent declining channel on NQ from the highs. Channel resistance there is at 2733 and channel support is at 2660:

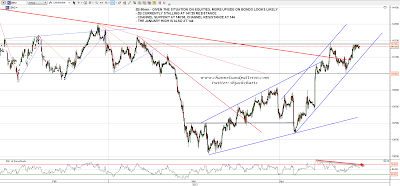
Given the picture on equities I'm leaning towards more upside on bonds. On the ZB chart channel support is at 140'30 and channel resistance is at 144. 144 was the January high of course, and is a key upside target for this move. ZB is currently stalling at 141'25, building what looks very much like a bull flag, and strong level support is in the 140 area if the channel should break down:
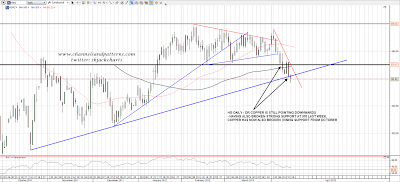
Dr Copper is looking distinctly bearish here. Strong support at the 370 level was broken last week and rising support from October was broken on Friday:
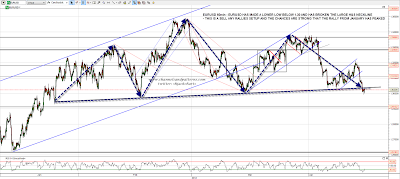
The most interesting chart this morning however is on EURUSD, where the large sloping H&S broke down overnight with EURUSD dipping slightly below 1.30 to break the February low. Both the H&S break and the lower low are technically significant, and it is now very probable that the rally from January has peaked. As I was showing in the USD analysis over the weekend, which you can see here, the potential downside for EURUSD is huge, and this setup is saying that any rallies on EURUSD should be sold:
I've mentioned before that I check quite a few sites in the mornings, and mention one every so often as a useful TA resource. The one I'd like to mention this morning is Bulkowski's blog, which you can find here. His weekend writeup has an interesting look at an ABC setup on the Nasdaq Composite and you can see that here. I use this site all the time as it also has a very useful section on chart patterns here, and on candlesticks here. For those of you not familiar with Bulkowski he wrote some of the key textbooks on Chart Patterns and Candlesticks.
The stats today really are strongly bullish, and we might well see a positive close today. Overall the trend looks unambiguously bearish however, and if we do see a positive close, I'm not expecting it to be strongly positive, and the move down should resume tomorrow. Worth noting also that this week is Opex week. I'll be watching the declining channels on ES and NQ today, and any moves towards the channel resistance trendlines should be good sell signals. EURUSD is also well worth keeping an eye on as we might see a strong move down from the H&S neckline. If we do then that would most likely carry equities down with it.
