
The one thing I especially like about Index trading is that it’s easier in my opinion to determine the likely direction because you can get a direct reading of all of its constituents. I’m going to share a chart that I’ve been using for some time now that gives me a general idea of the likely strength or weakness of the S&P500. It is the breadth readings for “Percentage of Stocks Above X simple moving averages“.
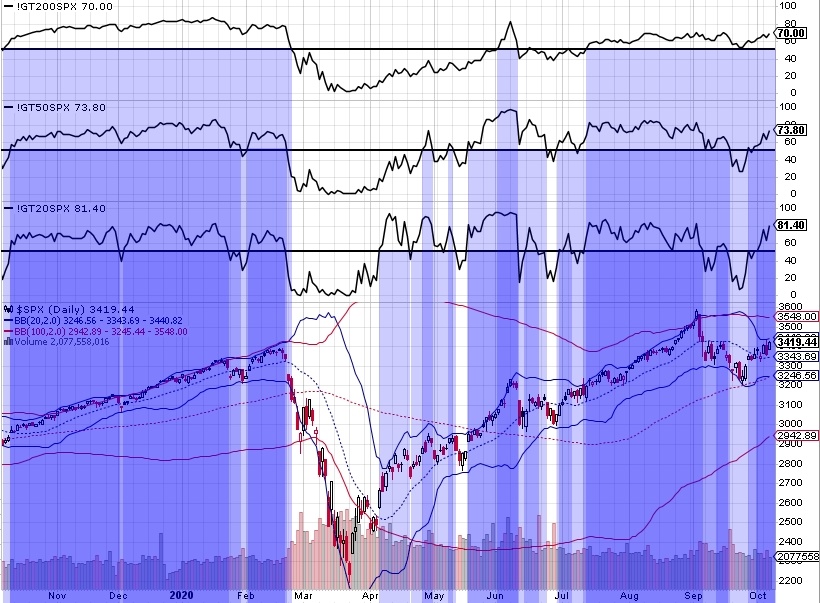
I’ve drawn a line at the 50 levels as a simple midpoint, but the general idea is that the higher the reading, the stronger the bullish influence on the index while the lower the reading, the stronger the bearish influence will be on the index.
Think of it like a “gas pedal” for short-term (20MA’s), intermediate-term (50MA’s) and long-term (200MA’s). When signals disagree, it tends to result in more range-bound and choppy trade while constituents are bouncing back and forth testing different MA’s. BUT when I get signals from different time period MA’s all aligned together in one direction, it creates a momentum train that is generally pretty persistent.
If history is to repeat here, shorts need to be careful in this environment. Our day will come again, but there’s no point stepping in front of a train before we get there.
Good trades to all!
