Editor’s note: I composed this post before Tesla began its free-fall, so it’s actually quite timely……..
I’d like to drive home the value of our new chart-based alert system with a real life example. How about we pick on a company which, over its history, has lost about $10 billion yet has managed to score a market cap approaching $900 billion: Tesla. Here is the precarious chart:
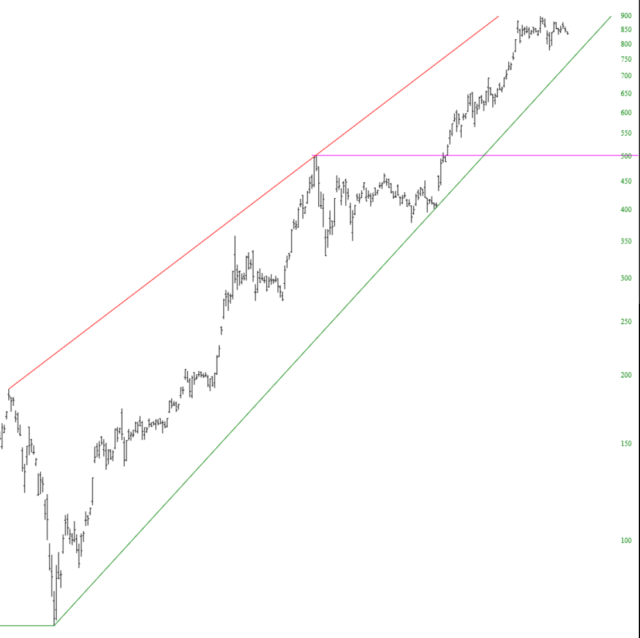
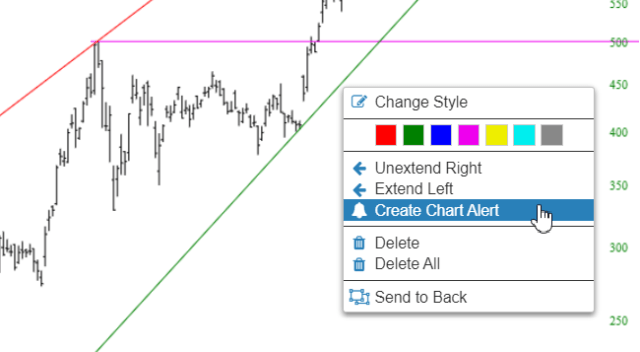
I think you would agree with me that the stock price breaking that green ascending trendline would be a very big deal. So instead of watching the chart every moment of the day, let’s let the Slope servers do the work for us. We right-click on the trendline and choose Create Chart Alert.
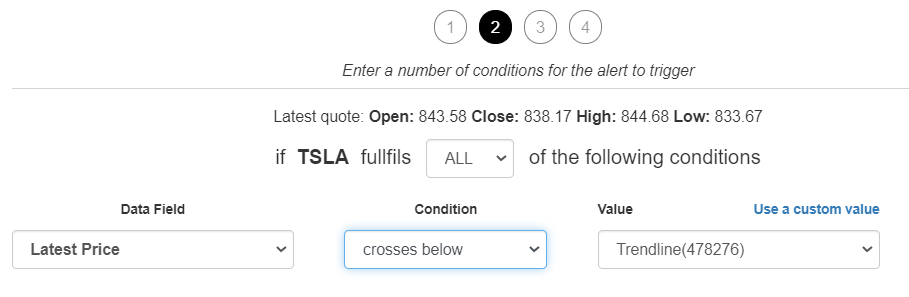
It has auto-populated all the pertinent information. I simply choose “crosses below“, since that is the “event” that would mean something to me.
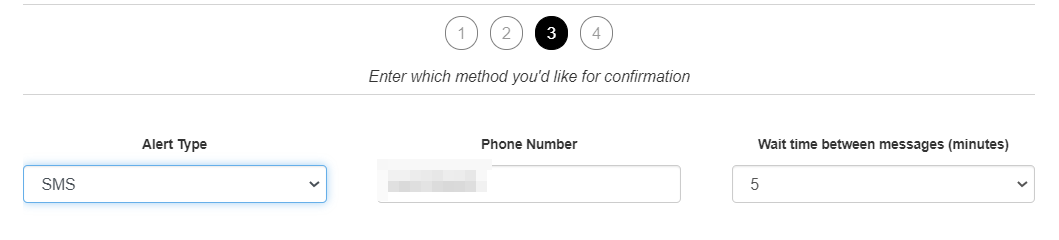
I could have an email alert or a text (SMS) alert. I want to hear about this at once, so I choose an SMS alert.
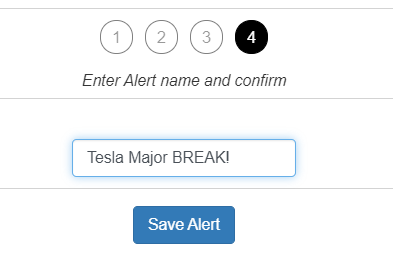
Finally, I give it a name so I know what this is all about.
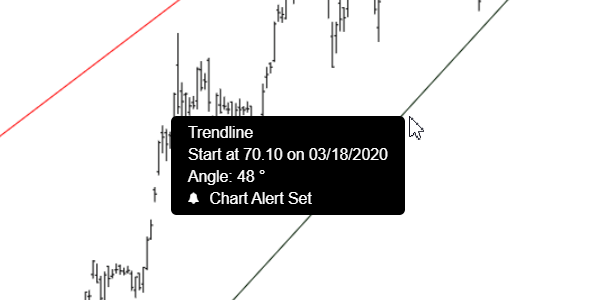
That’s all there is to it! We also added something else this morning which is helpful: let’s say a few weeks from now, I glance at TSLA again and think to myself how I should set up an alert (forgetting I had already done so). When I mouse over the trendline, it makes clear to me that an alert is already set, so I need not bother.
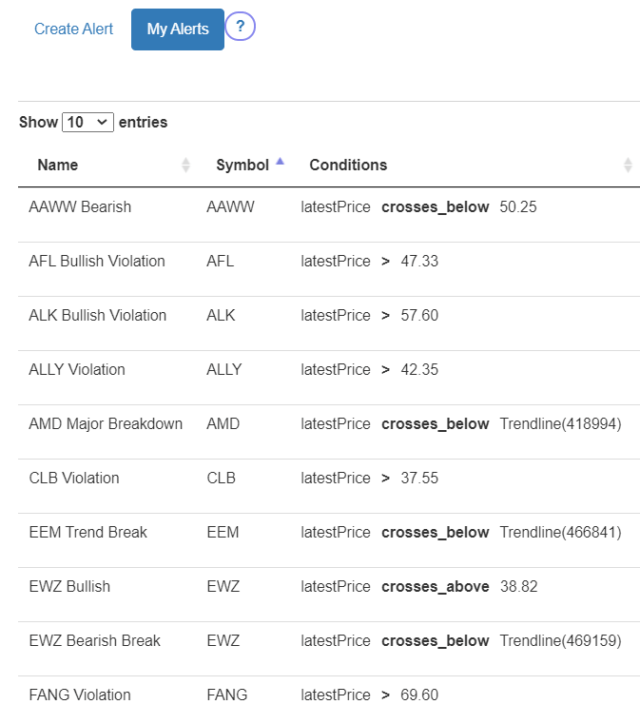
I have already entered a bunch of new alerts based on this new feature. I hope you folks can put it to good use.