
The FOMC bombshell wasn’t a complete surprise yesterday. I did mention in the morning that the Fed’s capability or courage to tighten policy was mainly theoretical, and it’s still mainly theoretical this morning. Of course the Fed have to walk a fine line between blowing up an asset bubble, and depressing the economy by removing the highly addictive stimulants that may be all that are maintaining the appearance of continuing economic vigor. The US is fortunate to have such a dedicated and highly qualified team operating the printing presses day and night, 365 days per year, and seemingly prepared to do so for the rest of time, or until the value of the US Dollar falls to zero, whichever comes sooner:

After the FOMC spike up to new highs yesterday I am still leaning bullish, though I would point out that the SPX high yesterday was exactly at the retest of broken rising megaphone support that I was looking at on Monday as part of my bear scenario. If that holds then we could still see the double-top play out. Other things to note are the punch over the daily upper bollinger band after FOMC yesterday. I would expect the upper band to close in the 1722-5 area today so unless SPX is going to stay above the band, upside today looks limited. SPX daily chart:
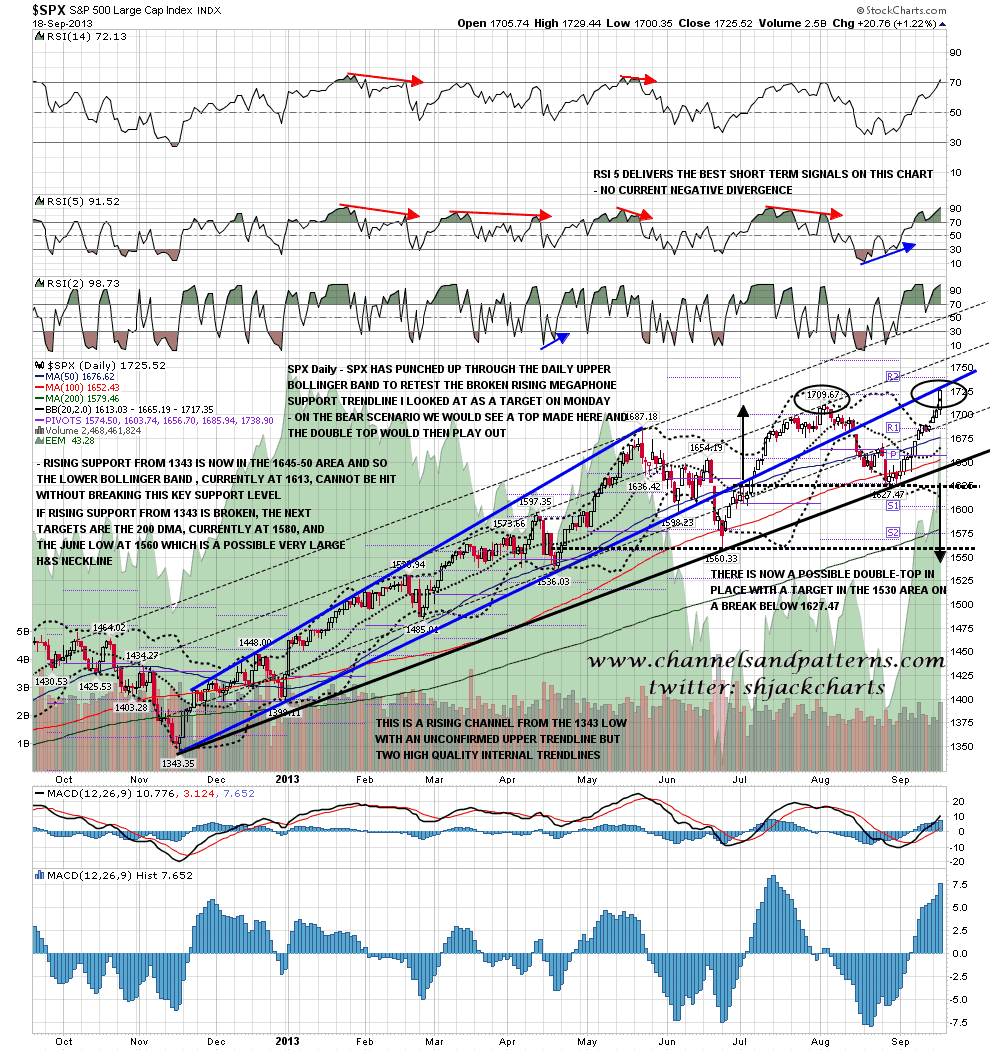
On the chart above I have a rising channel drawn in from the 1343 low, which is where I would expect to see a major pattern develop from on my bullish scenario into 1965. The upper trendline is currently theoretical, but there are two strong internal trendlines that support this channel. The next internal resistance trendline would be in the 1760 area and theoretical main channel resistance is currently in the 1790-1800 area. Of the three options for a major trending pattern (wedge, channel or megaphone) a rising wedge looks unlikely, so I have drawn in a possible option for a rising megaphone as well as the more likely channel on the chart above.
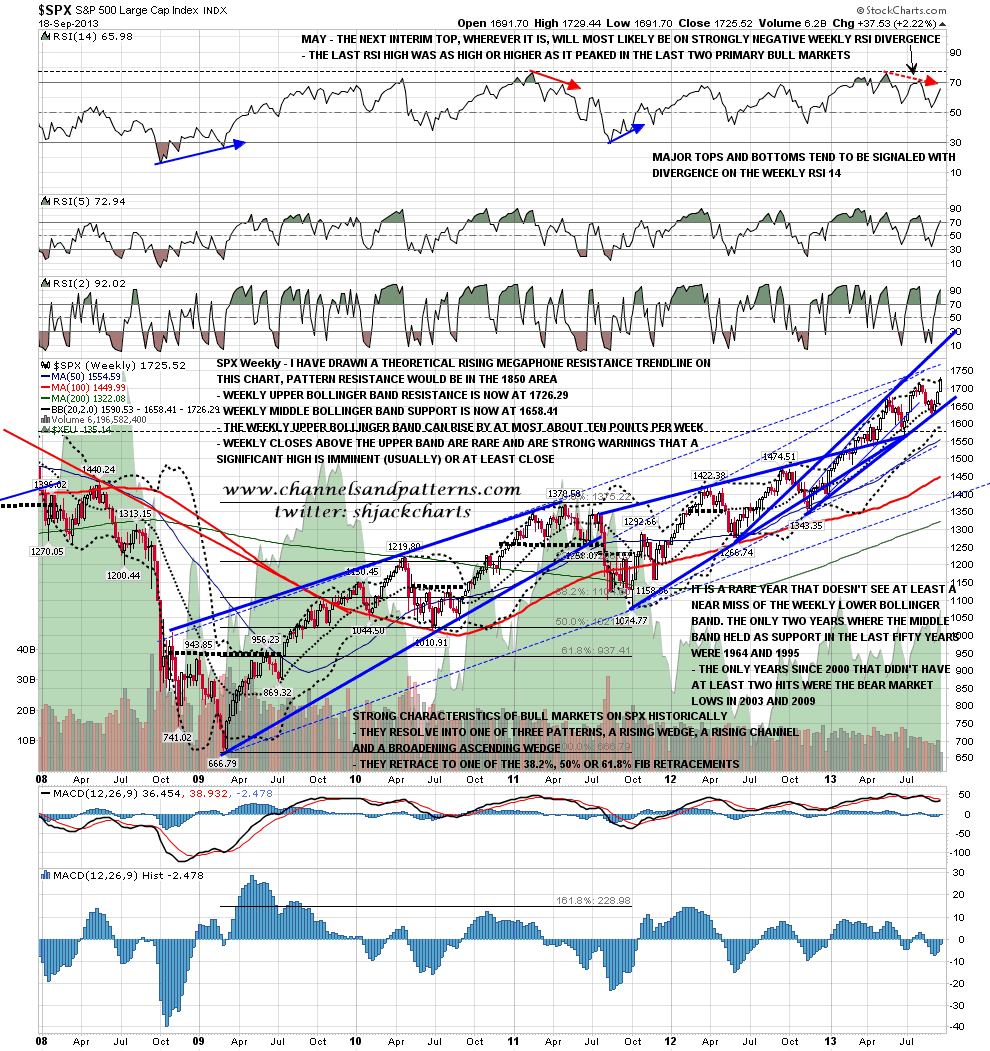
On this weekly chart I would also note that the close yesterday was within a point of the weekly upper bollinger band. This is strong resistance and a weekly close or punch over it is a strong signal that a significant high is close. In a strong trend this can rise by up to ten points per week but no faster, so the prospects for a very fast move up from here are slim, and if we see that punch over this upper band we should start looking hard for the next top. SPX weekly chart:
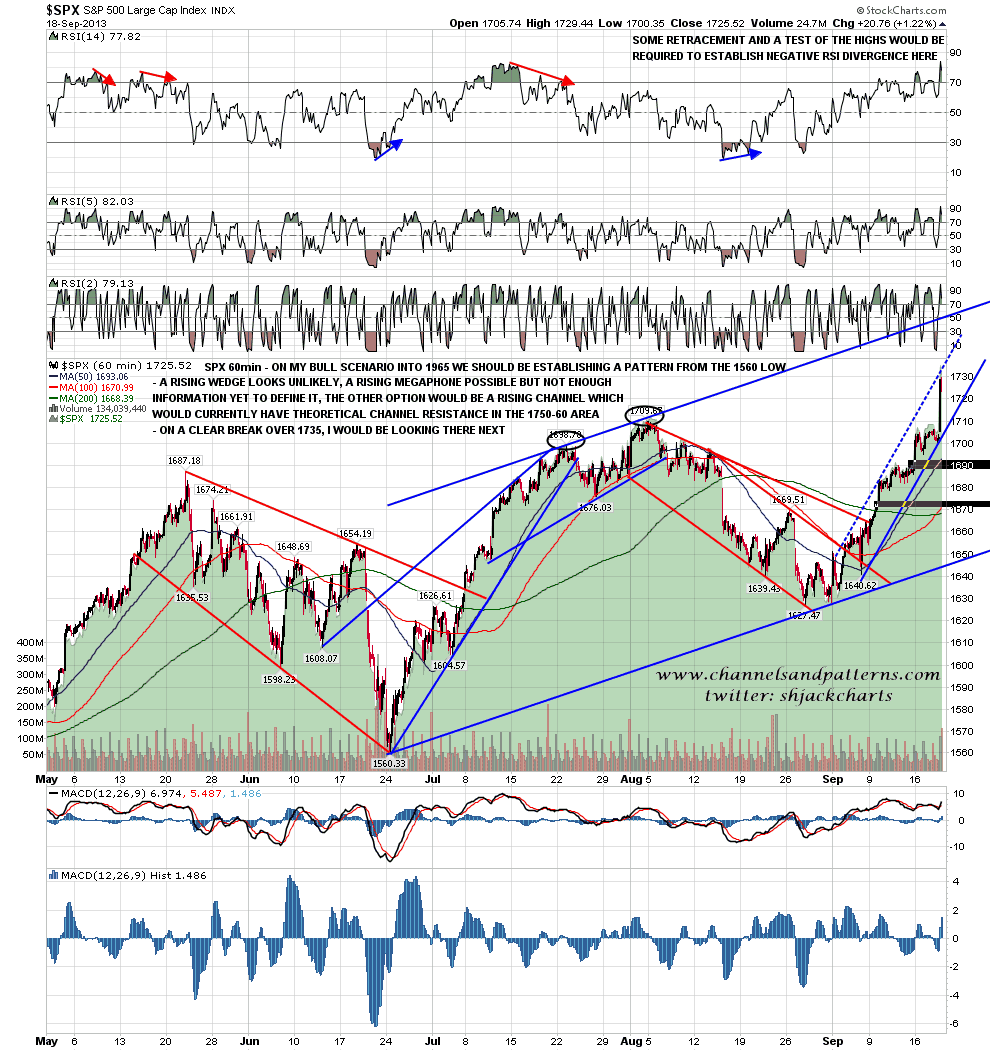
On the SPX 60min chart I have a possible rising channel in play from the 1560 low and possible channel resistance would be in the 1750-60 area. I have a shorter term channel from 1640 that would require a little higher than yesterday’s high before a retracement into rising channel support in the 1710-15 area. SPX 60min chart:
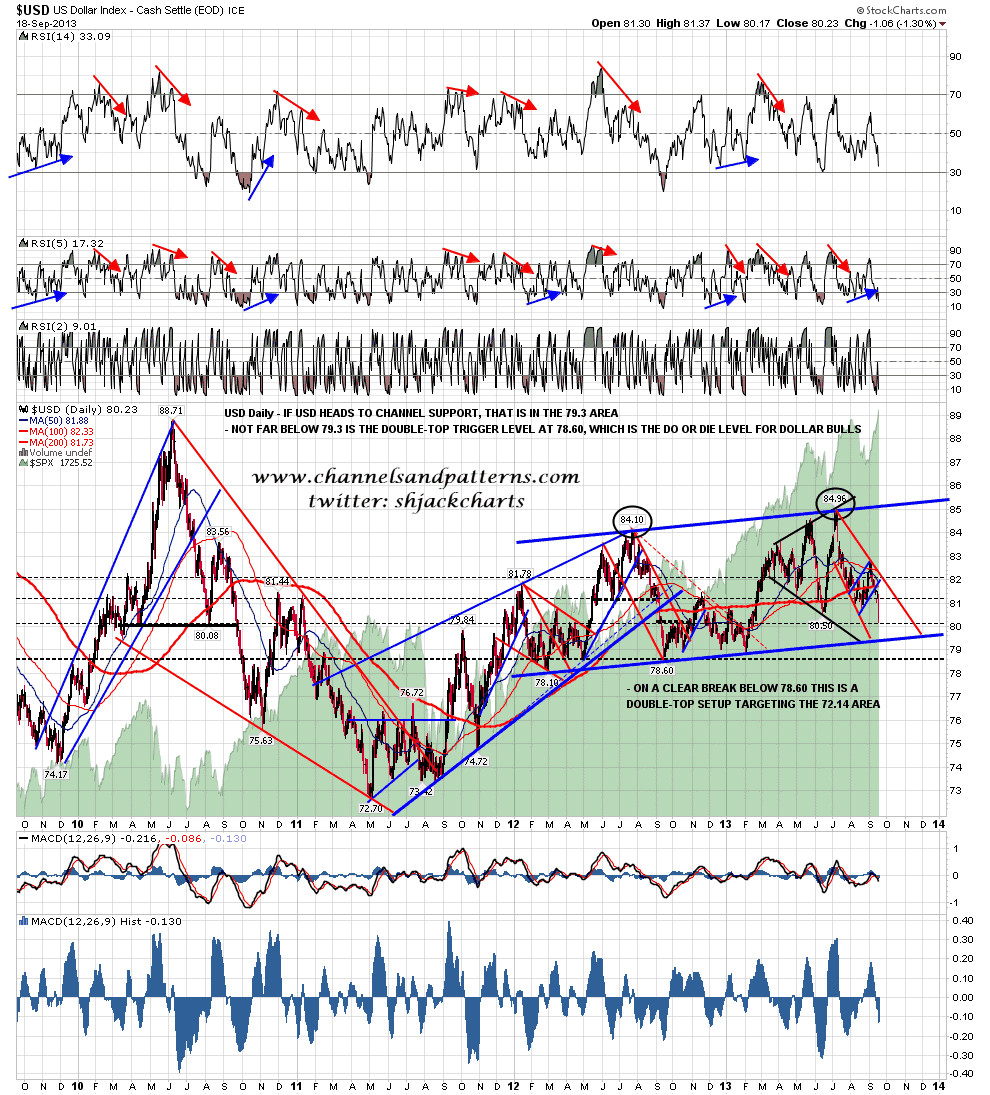
USD was hammered by the FOMC announcement yesterday and fell considerably. I’ve posted my main USD chart before, and I have primary support in the 79.3 to 79.5 area, and then last ditch support and the trigger level for a possible game changer double-top at 78.60. The bull market on USD from 2011 isn’t over until we see those break, but obviously it is in serious and increasing doubt. USD daily chart:
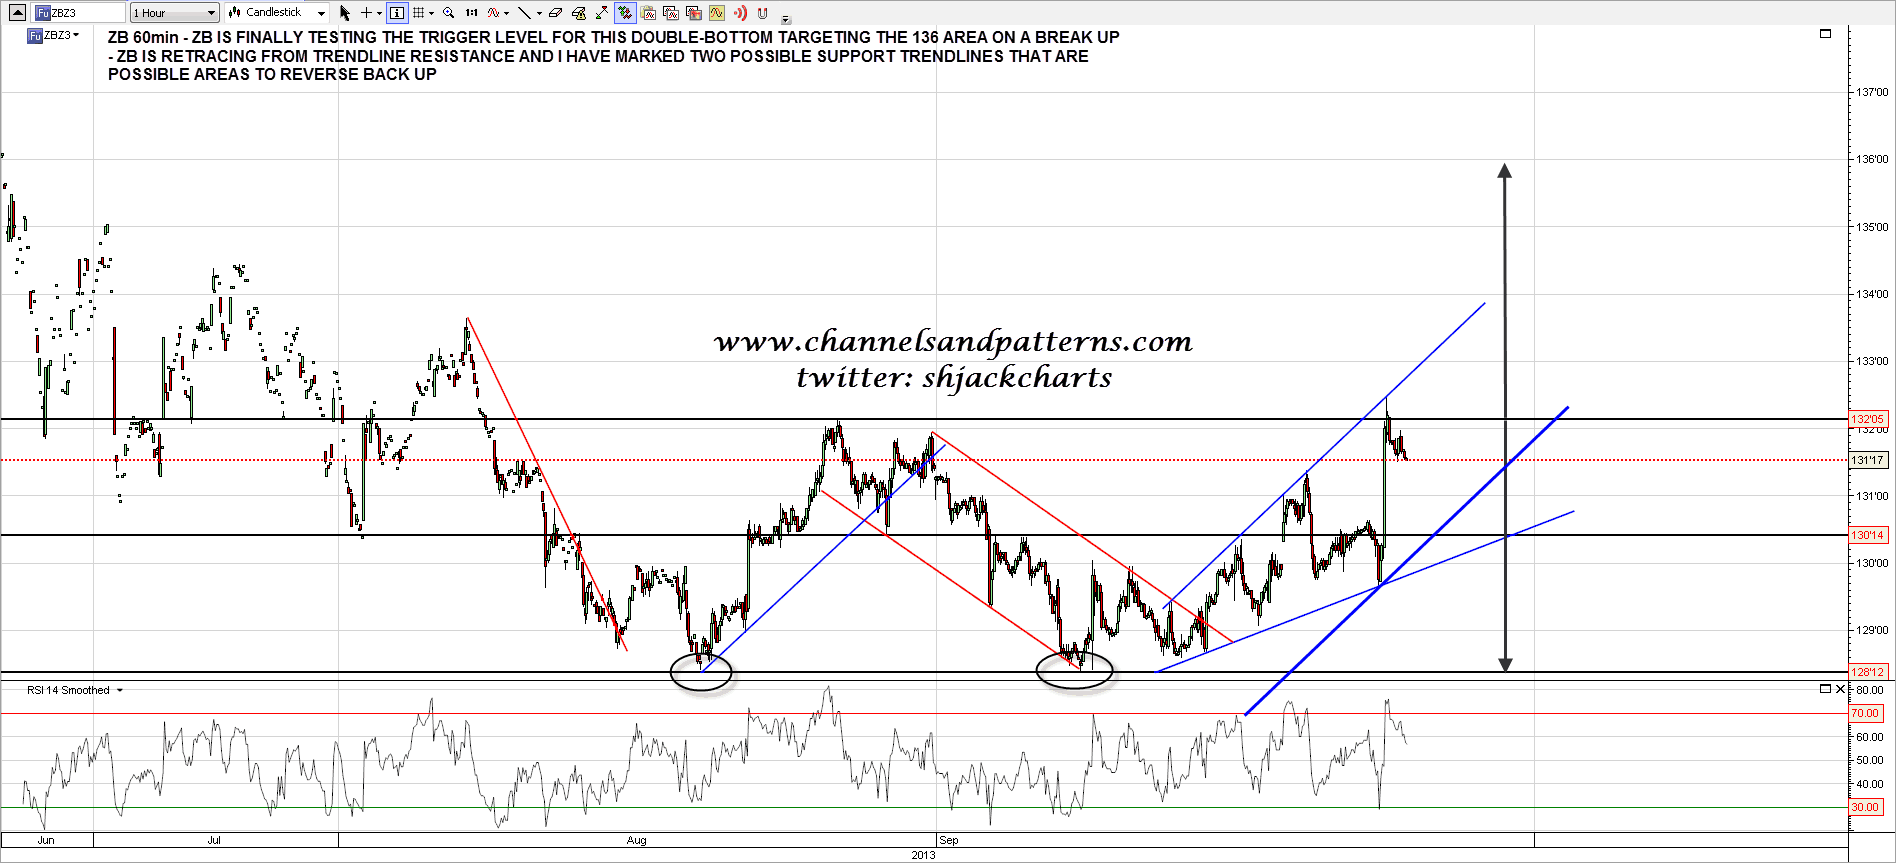
ZB broke up on the FOMC announcement and is now testing the double-bottom trigger level that will target the 136 area if ZB can break above it. ZB is retracing from some trendline resistance and I have marked two possible trendline targets on the chart. ZB 60min chart:
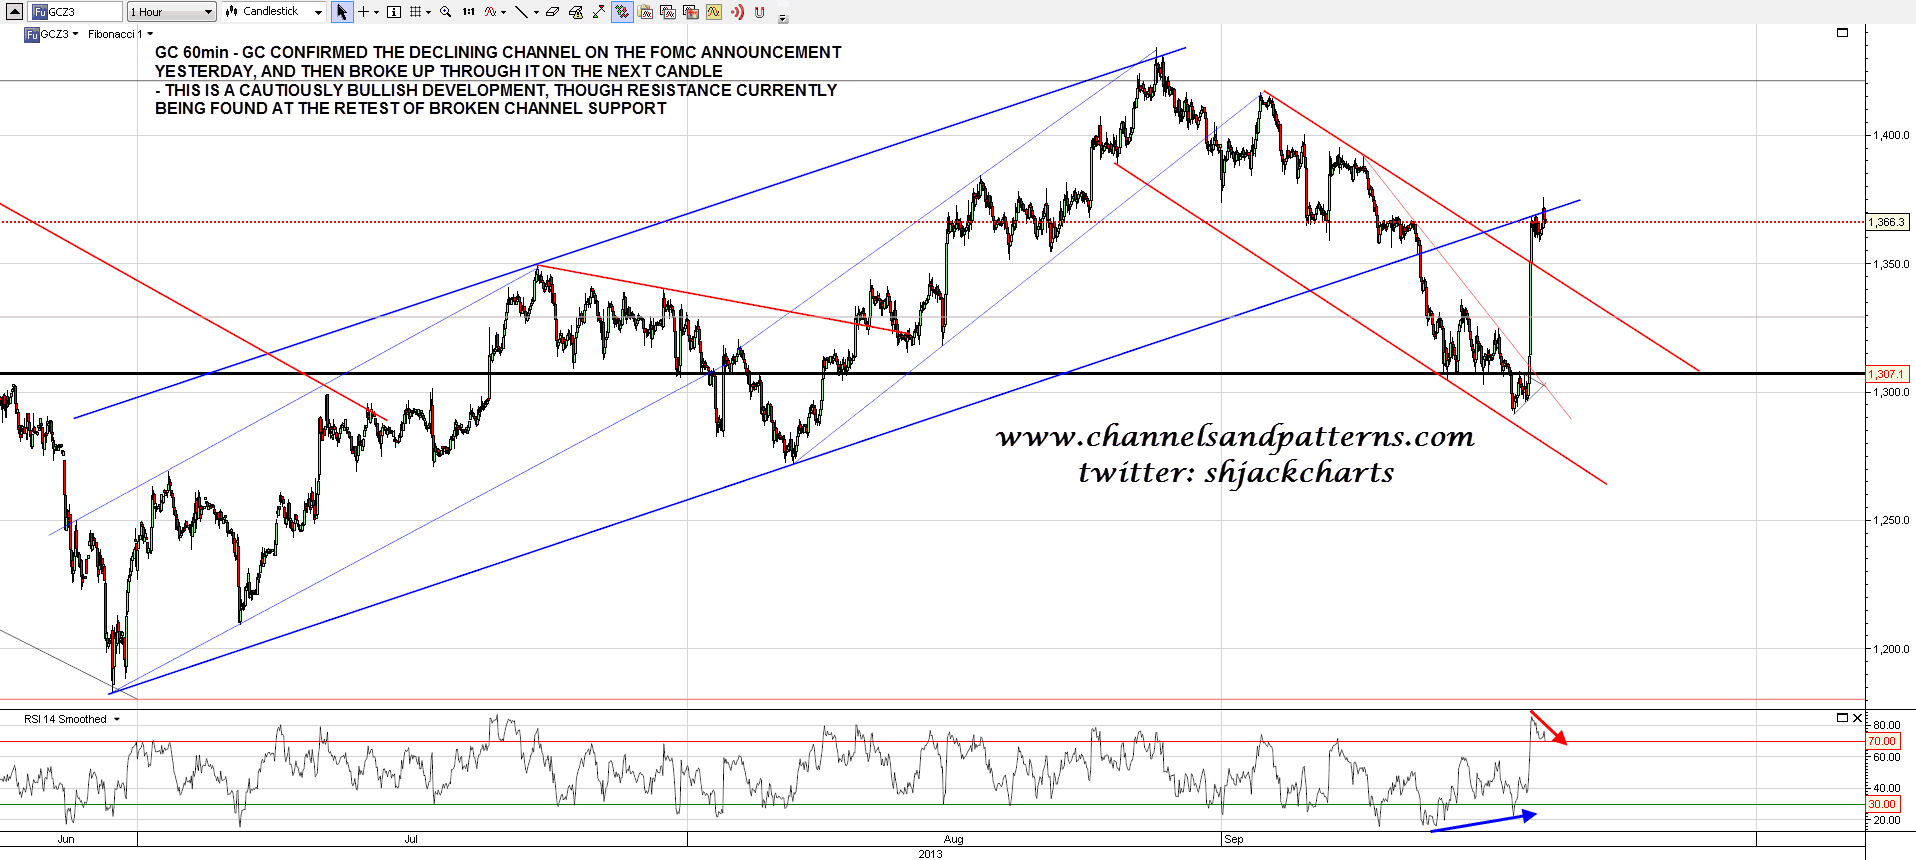
GC spiked up on the FOMC announcement to exactly test declining channel resistance, and retraced there, but then returned to break up from the channel on the next hourly candle. I’m treating this break up as cautiously bullish, though GC is finding some resistance for the moment at the retest of broken rising channel support. GC 60min chart:
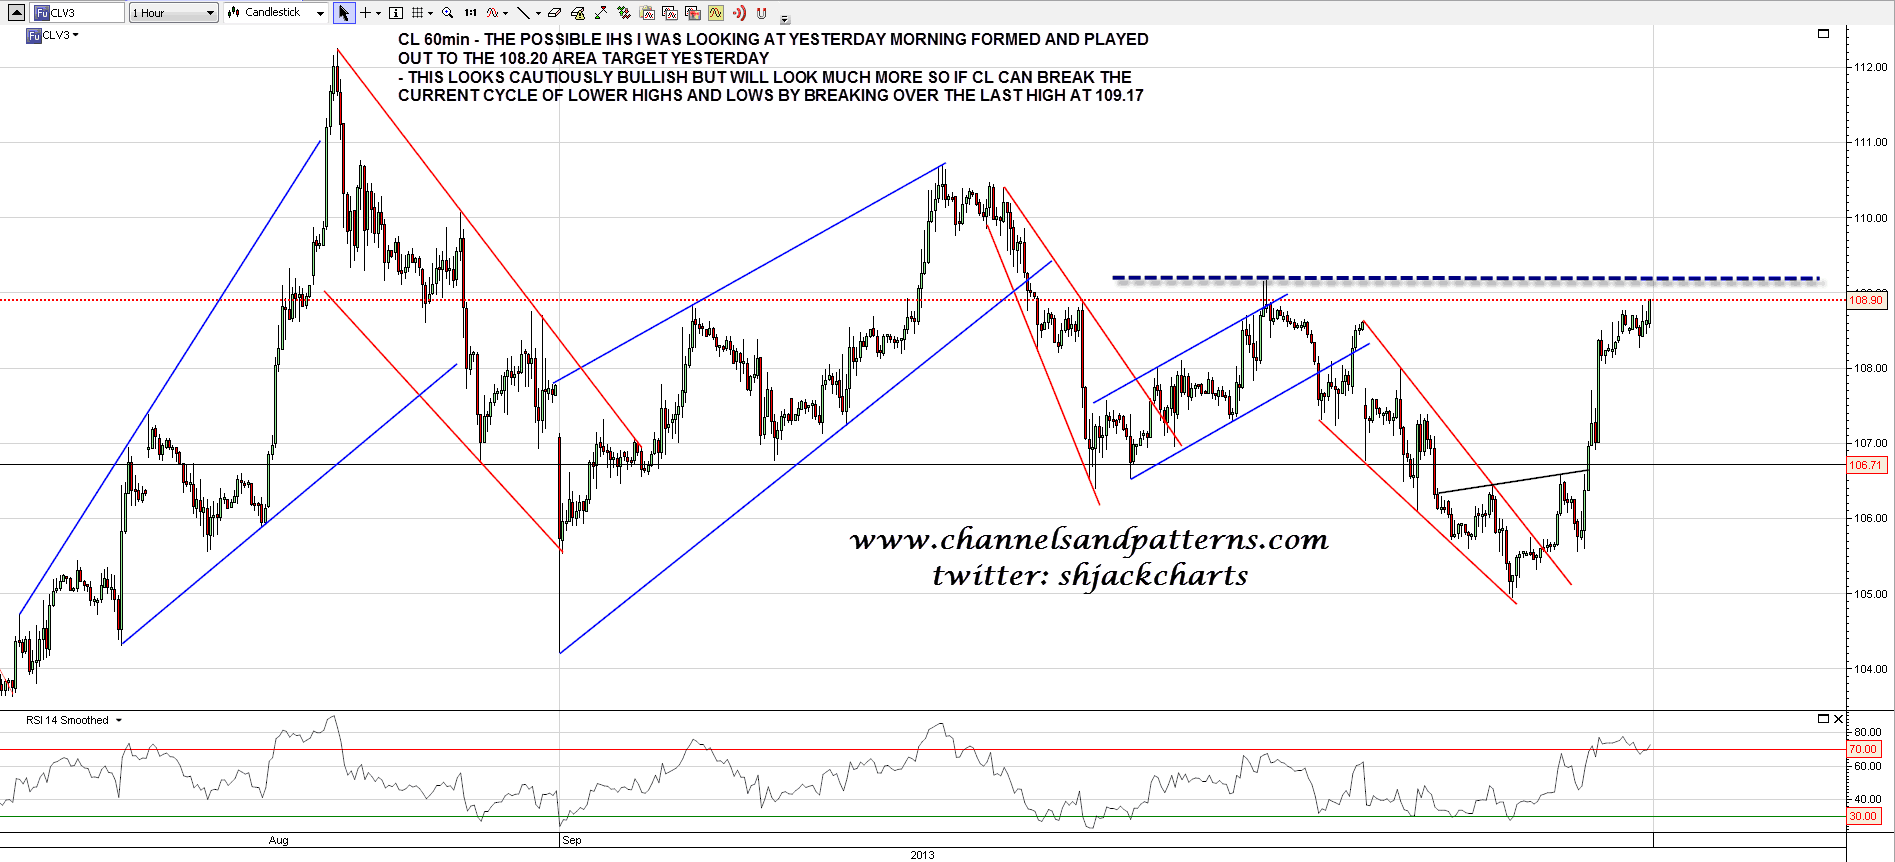
I gave two bottoming options for CL yesterday morning after the break up from the falling wedge, and CL went on to complete the IHS option, which played out to the 108.2 target in the afternoon. This again is cautiously bullish, but CL needs to break over the last high at 109.17 to break the current series of lower highs and lows. CL 60min chart:
As SPX closed at the weekly upper band yesterday I’m expecting to see more of a two way market until the next short term high is made. For the next short term high on SPX, which we may well see in the next couple of trading days, I’ll be looking out for a sharp retracement and then a marginal new high to establish negative divergence on the SPX 60min RSI 14 and the SPX daily RSI 5. The opening gap up will most likely be filled today.
