
Good morning, everyone. Well, when I started typing this post, the markets were all green. Now, as I start to add some text around the graphs, it’s gone red. So the charts below are out of date in that respect, although what I was going to say hasn’t changed.
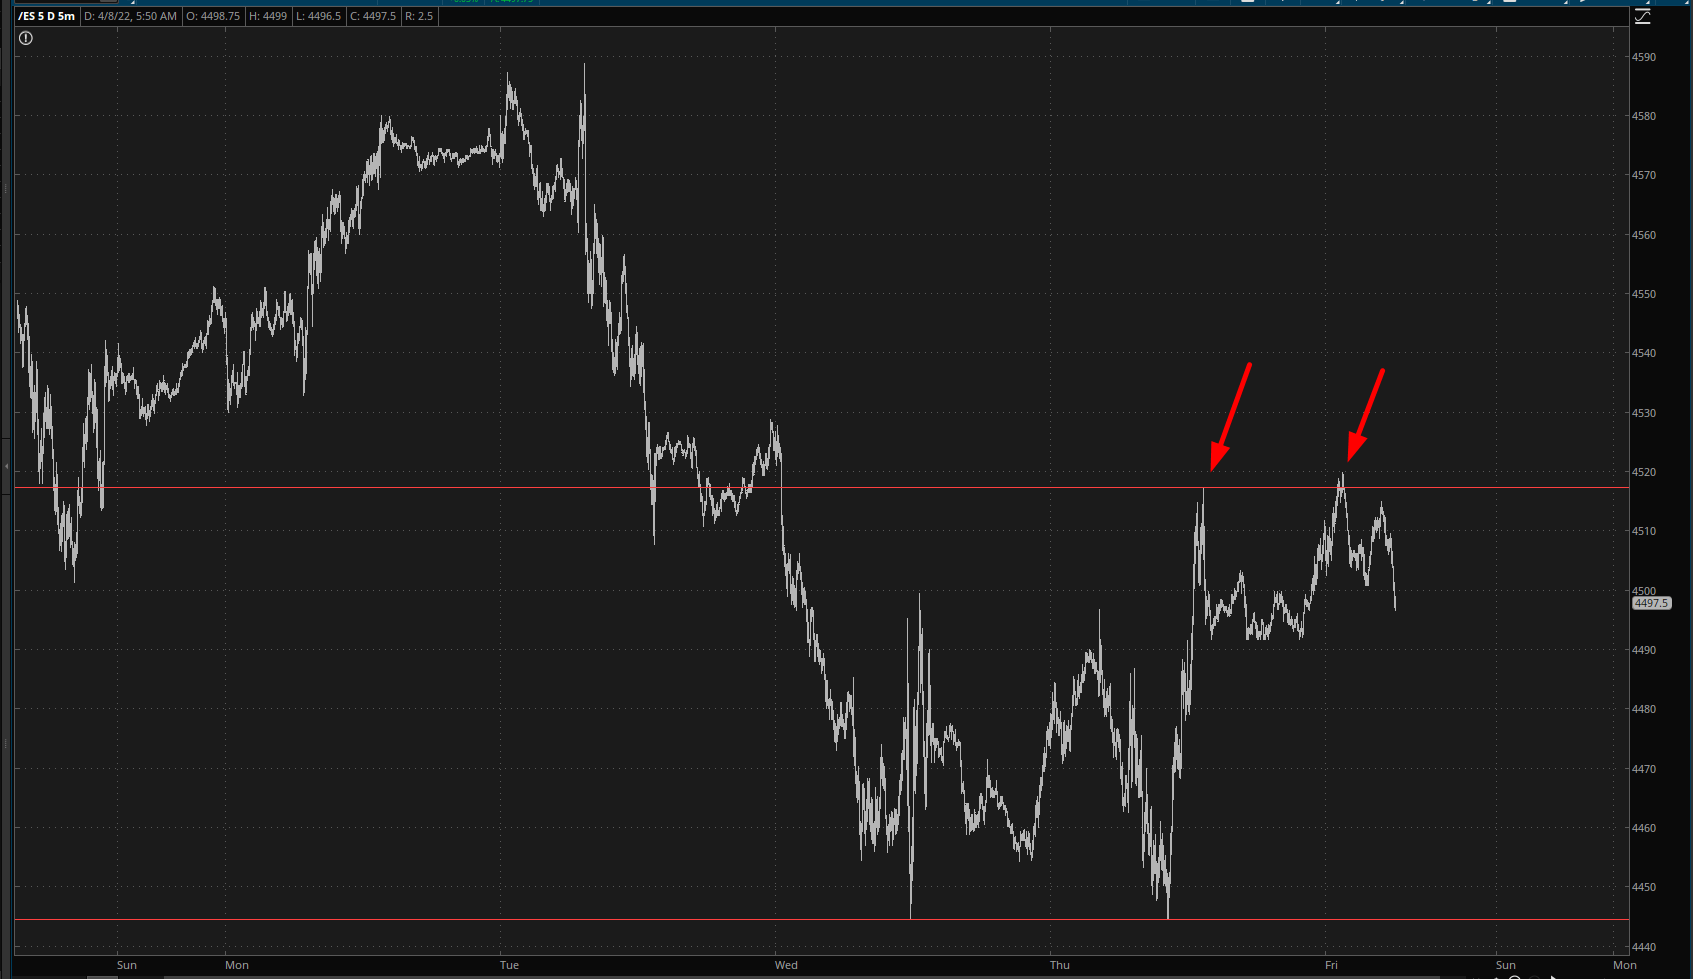
Last night, the /ES tried to cut above short-term resistance, but it was repelled.

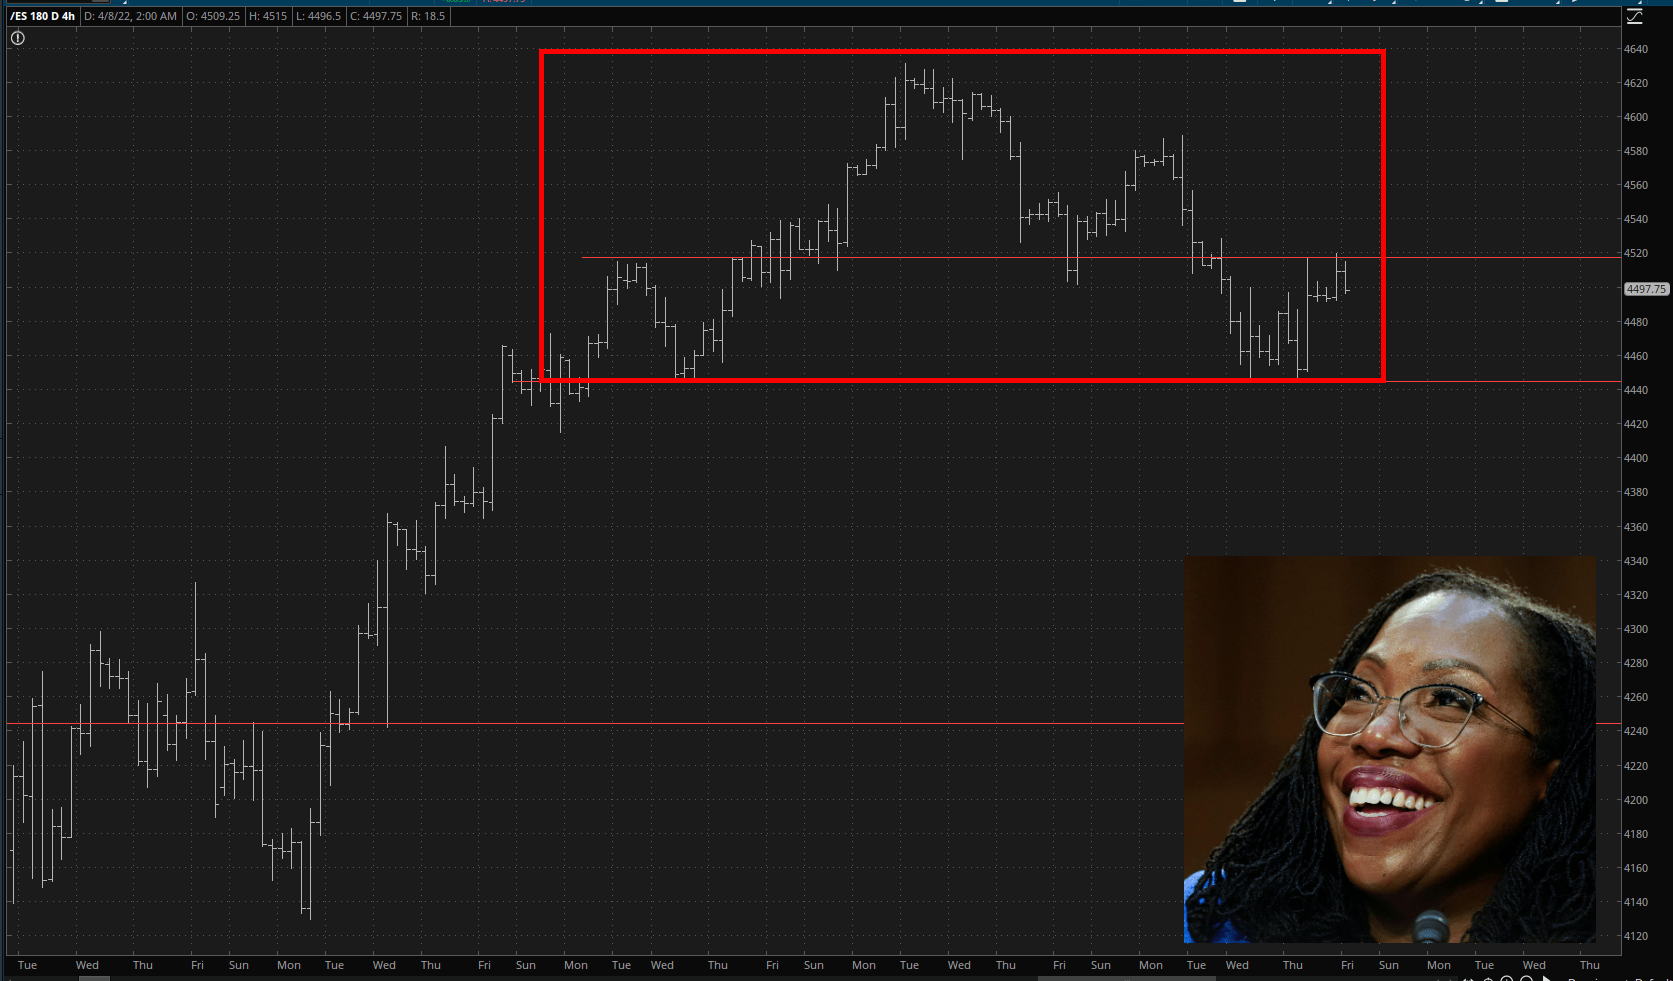
From a slightly longer-term perspective, you can see how helpful the mass of overhead supply is. Of course, what we bears want to see – – and we are a hearty, lusty lot, the three of us – – is a failure of 4444. I would be flabbergasted if it happened today, but that’s the key, and very easy to remember, number.
Looking even more broadly, you can see the top on the /ES has become quite well-defined at this point.
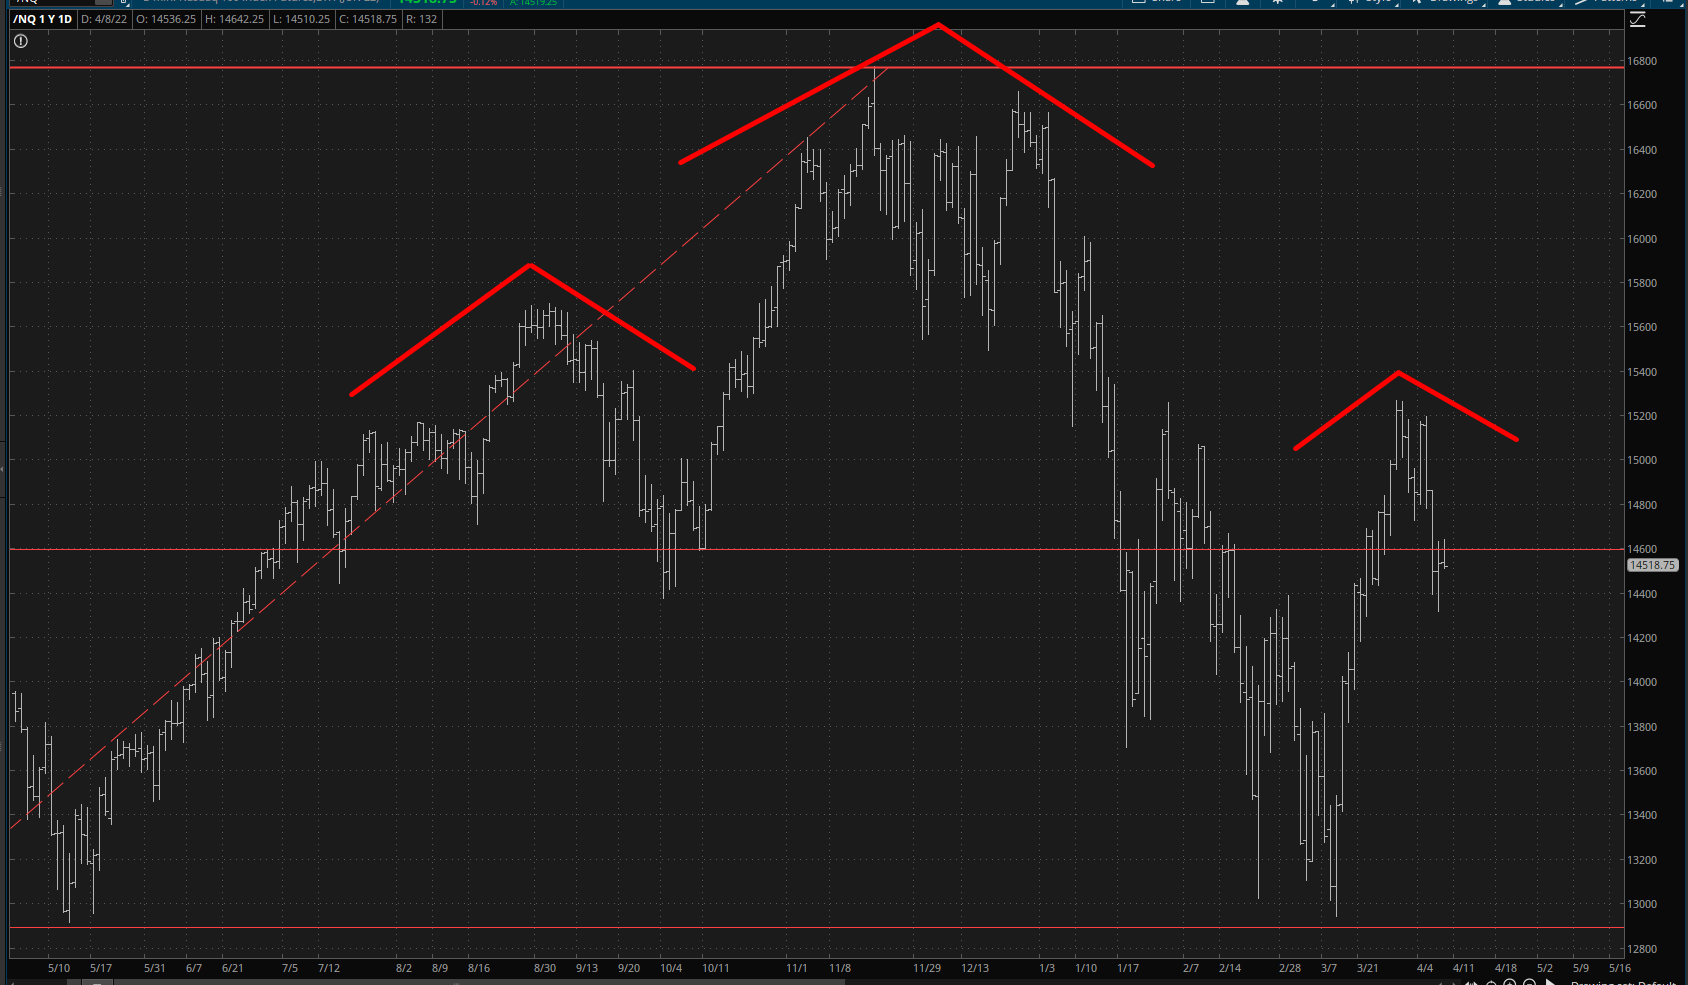
The /NQ likewise has a formidable top, and this is conjured up at an even longer-term timeframe. What I’m saying is that, if the earnings season blows at our backs properly, we could be in for a total bear-fest.
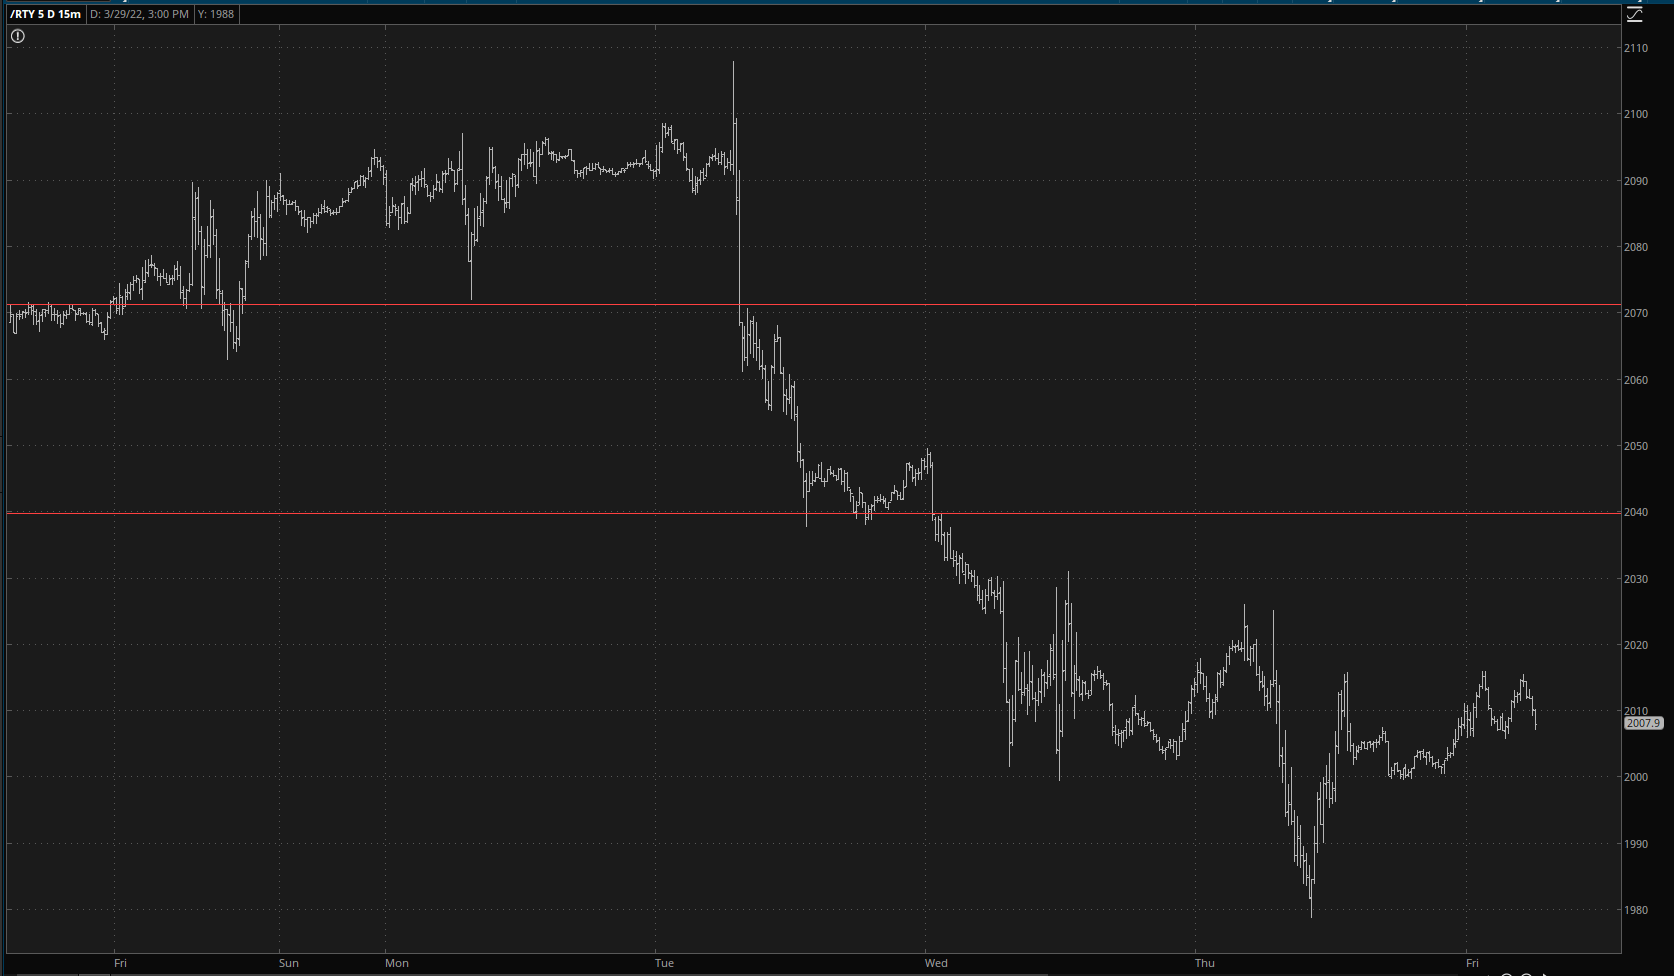
My most substantial position is by way of IWM puts, which I’ll illustrate below with the /RTY futures. In recent days, we’ve enjoyed a steady series of lower highs. However, that base, suggested by the broad “V” bottom below, must be broken.
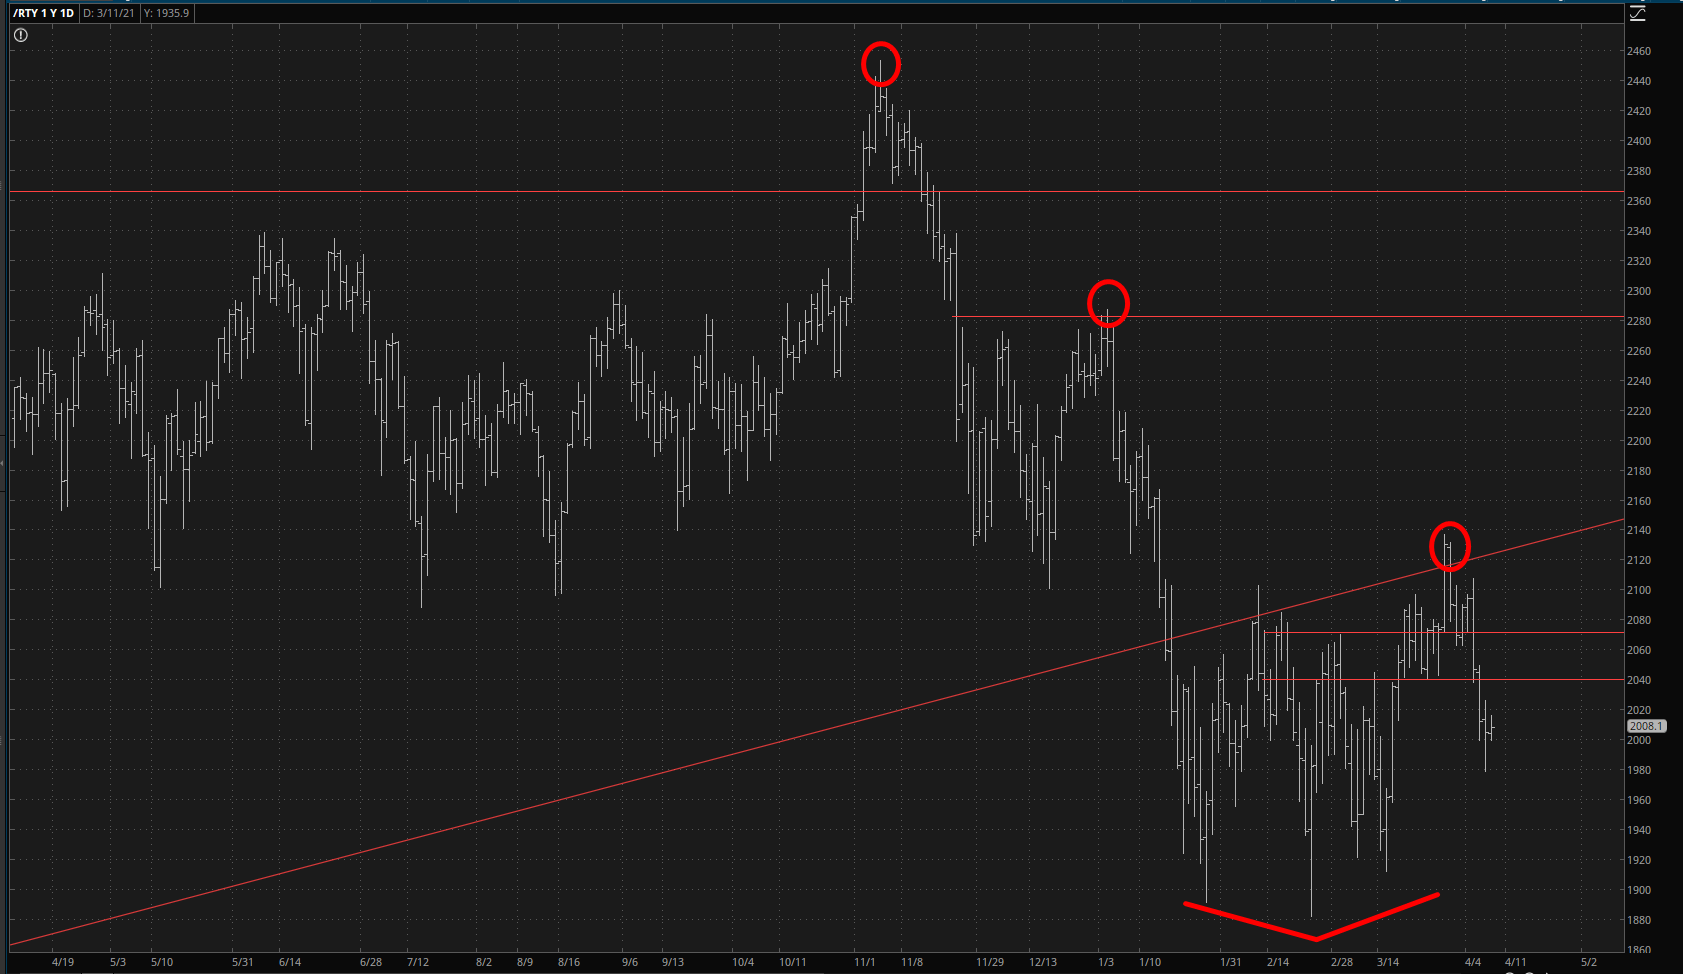
The closer view shows the smooth glide path the /RTY has been taking, but again, but we’ve worked our way down to a mild bullish base, and we must conquer it. I’m out of buying power, so I can’t help!
As I enter this final day of the trading week, I have 35 positions. 27 are in the green, and 8 are in the red. The most severe loss among these is 9.48% and the best gain is 84.68% (Morgan Stanley, of all things) with an overall profit of 20.44% across all positions. Average expiration date on my put options is 106 days. So let’s go get ’em!
