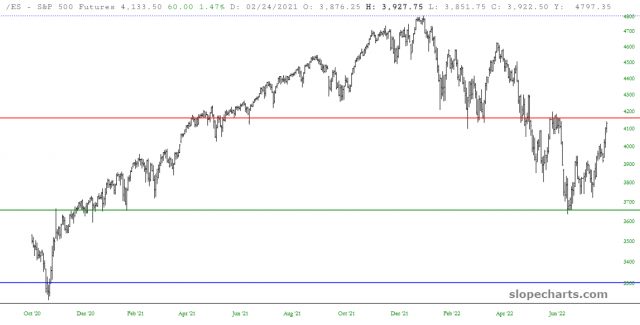
I want you to know what caliber of genius and pigheaded idiot you’re dealing with. By way of introduction, I share with you below the premium post published on July 21st. In its entirety:
I just had one of those “whoa!” moments that I wanted to share with just my premium members. I just put together this chart for you of the /ES, which I’ll explain next. As always, you can click on it for a larger version.
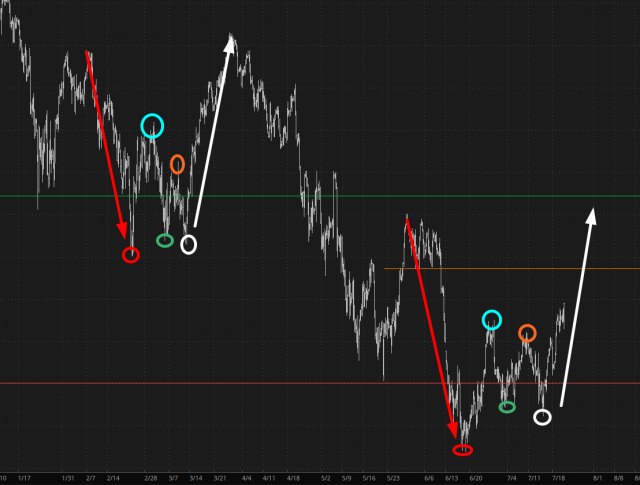
For once, I’m going to set aside what I want, what I wish, what I hope for, and basically stop talking my book. The arrows and circles are fairly self explanatory, but let’s walk this through in chronological order:
- There’s a big plunge (red arrow) which terminates (red circle);
- There’s a strong counter-trend bounce which exhausts itself (cyan circle);
- The market falls again, not getting as low as before (green circle);
- The market rises again, not getting as high as before (orange circle);
- The market falls again, getting below step “3” but not as low as step “1” (white circle);
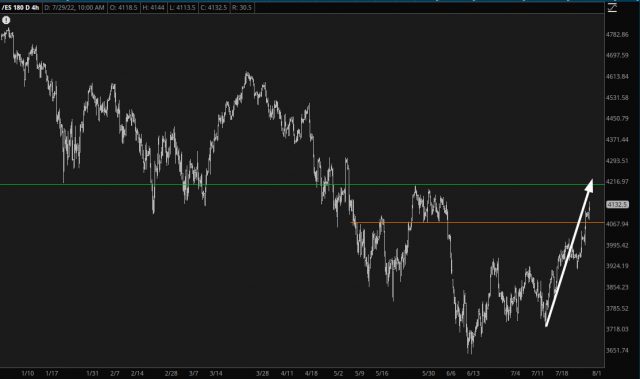
- Then – – and here’s the frightful prospect!! – – it goes absolutely roaring higher, even higher than when the step (1) plunge commenced (white arrow)
If this transpires again, we’re talking about an /ES above 4,200.
Now, I would point out that we’re dealing with a sample set of ONE here, folks. At the same time, I am awestruck at how similar this behavior is. I’ve done this long enough that I have an eye for these things, and when I glanced at the /ES chart on this timeframe (4 hour bars) I had an a-ha moment.
This market has been a big fat drag since June 16th, but let’s face it, this is the nature of bear markets – – ultimately, they disappoint BOTH sides, which is a feat unto itself. I am continuing to tilt at these windmills, but I just wanted to go on record that the Atilla-like projection of a push to around 4200 may well indeed be in the cards. His arrogance really gets under my skin, but he may just be right. If so, we’re only about 55% done with this white arrow from hell.
OK, that’s the end of the July 21st post.
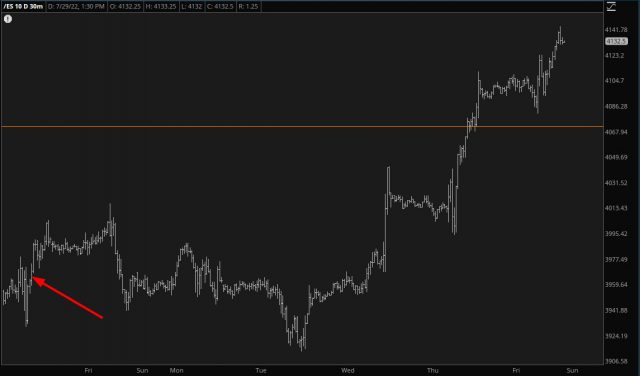
As is so often the case, having received one of these “light bulb over the head” moments of clarity and insight, I decided to share it with my readers (one of whom, Sloper Bob, has reportedly made a huge wad of cash with it) and – – for myself – -completely ignore it. Indeed, if you look at the /ES after I did this post (see arrow), the market DID stall out and give us poor dumb bears some hope, but the simple fact of the matter was that the fate of the /ES was already sealed, and it just needed a few days before it launched into BBQ-the-Bears mode. We’re talking over 200 /ES points, folks.
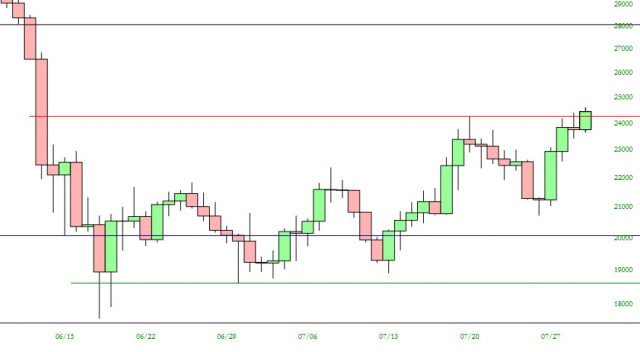
And, even now, I’m thinking, “make it stop, make it stop“, but look at Bitcoin right now, uh-uh, not yet. This is terrifying, too.
So I draw two conclusions from this:
- For the love of God, pay attention to my charts, and not my own actions. I’m an idiot, but my charts are really, really good.
- The white arrow from hell has been brutal, but if there are any surviving bears out there, hang in there, pal. It won’t be much longer.
I’ll add one more bit of solace for my longer-suffering, beloved bearish brothers. Below is the chart of the /ES with a multi-year Fibonacci retracement. See that red line? Besides me, it’s your best friend.
