Preface to all five HSE posts: My original idea was to have a series of bearish charts that were still intact and the formerly-bearish charts which had been wrecked. The vast majority are still intact, however, so I’ve instead broken up the ETF charts into five different categories, and I’ve included remarks in the caption of each chart (which, as always, can be clicked for a larger, more readable version). As for H.S.E., that stands for Hope Springs Eternal (in the bearish breast)………….
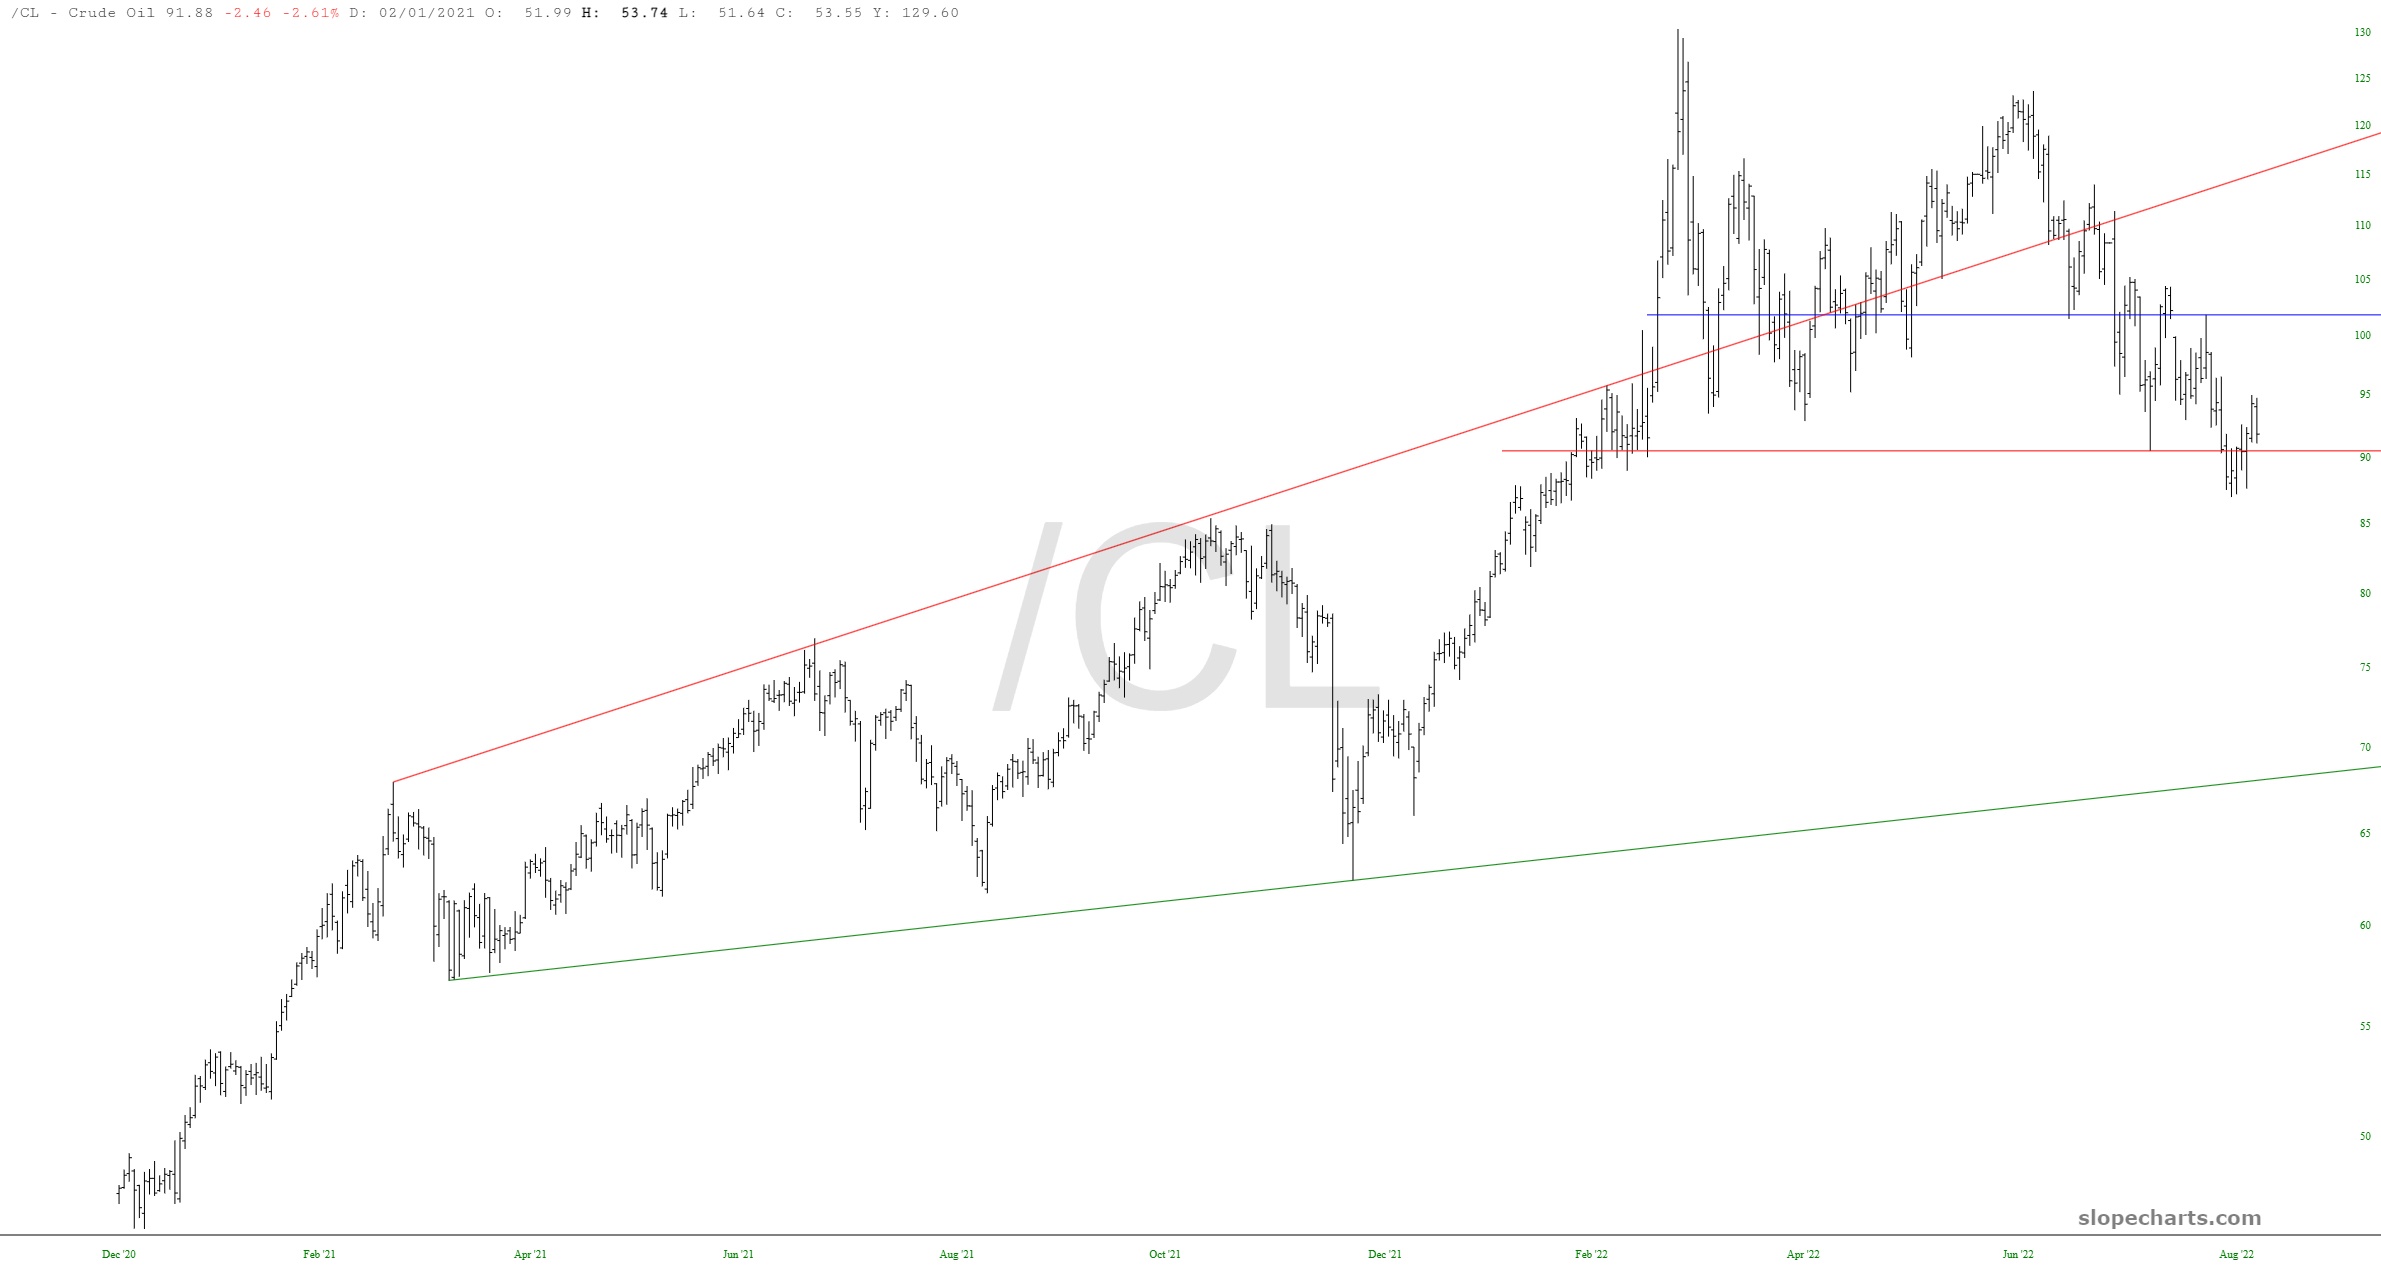
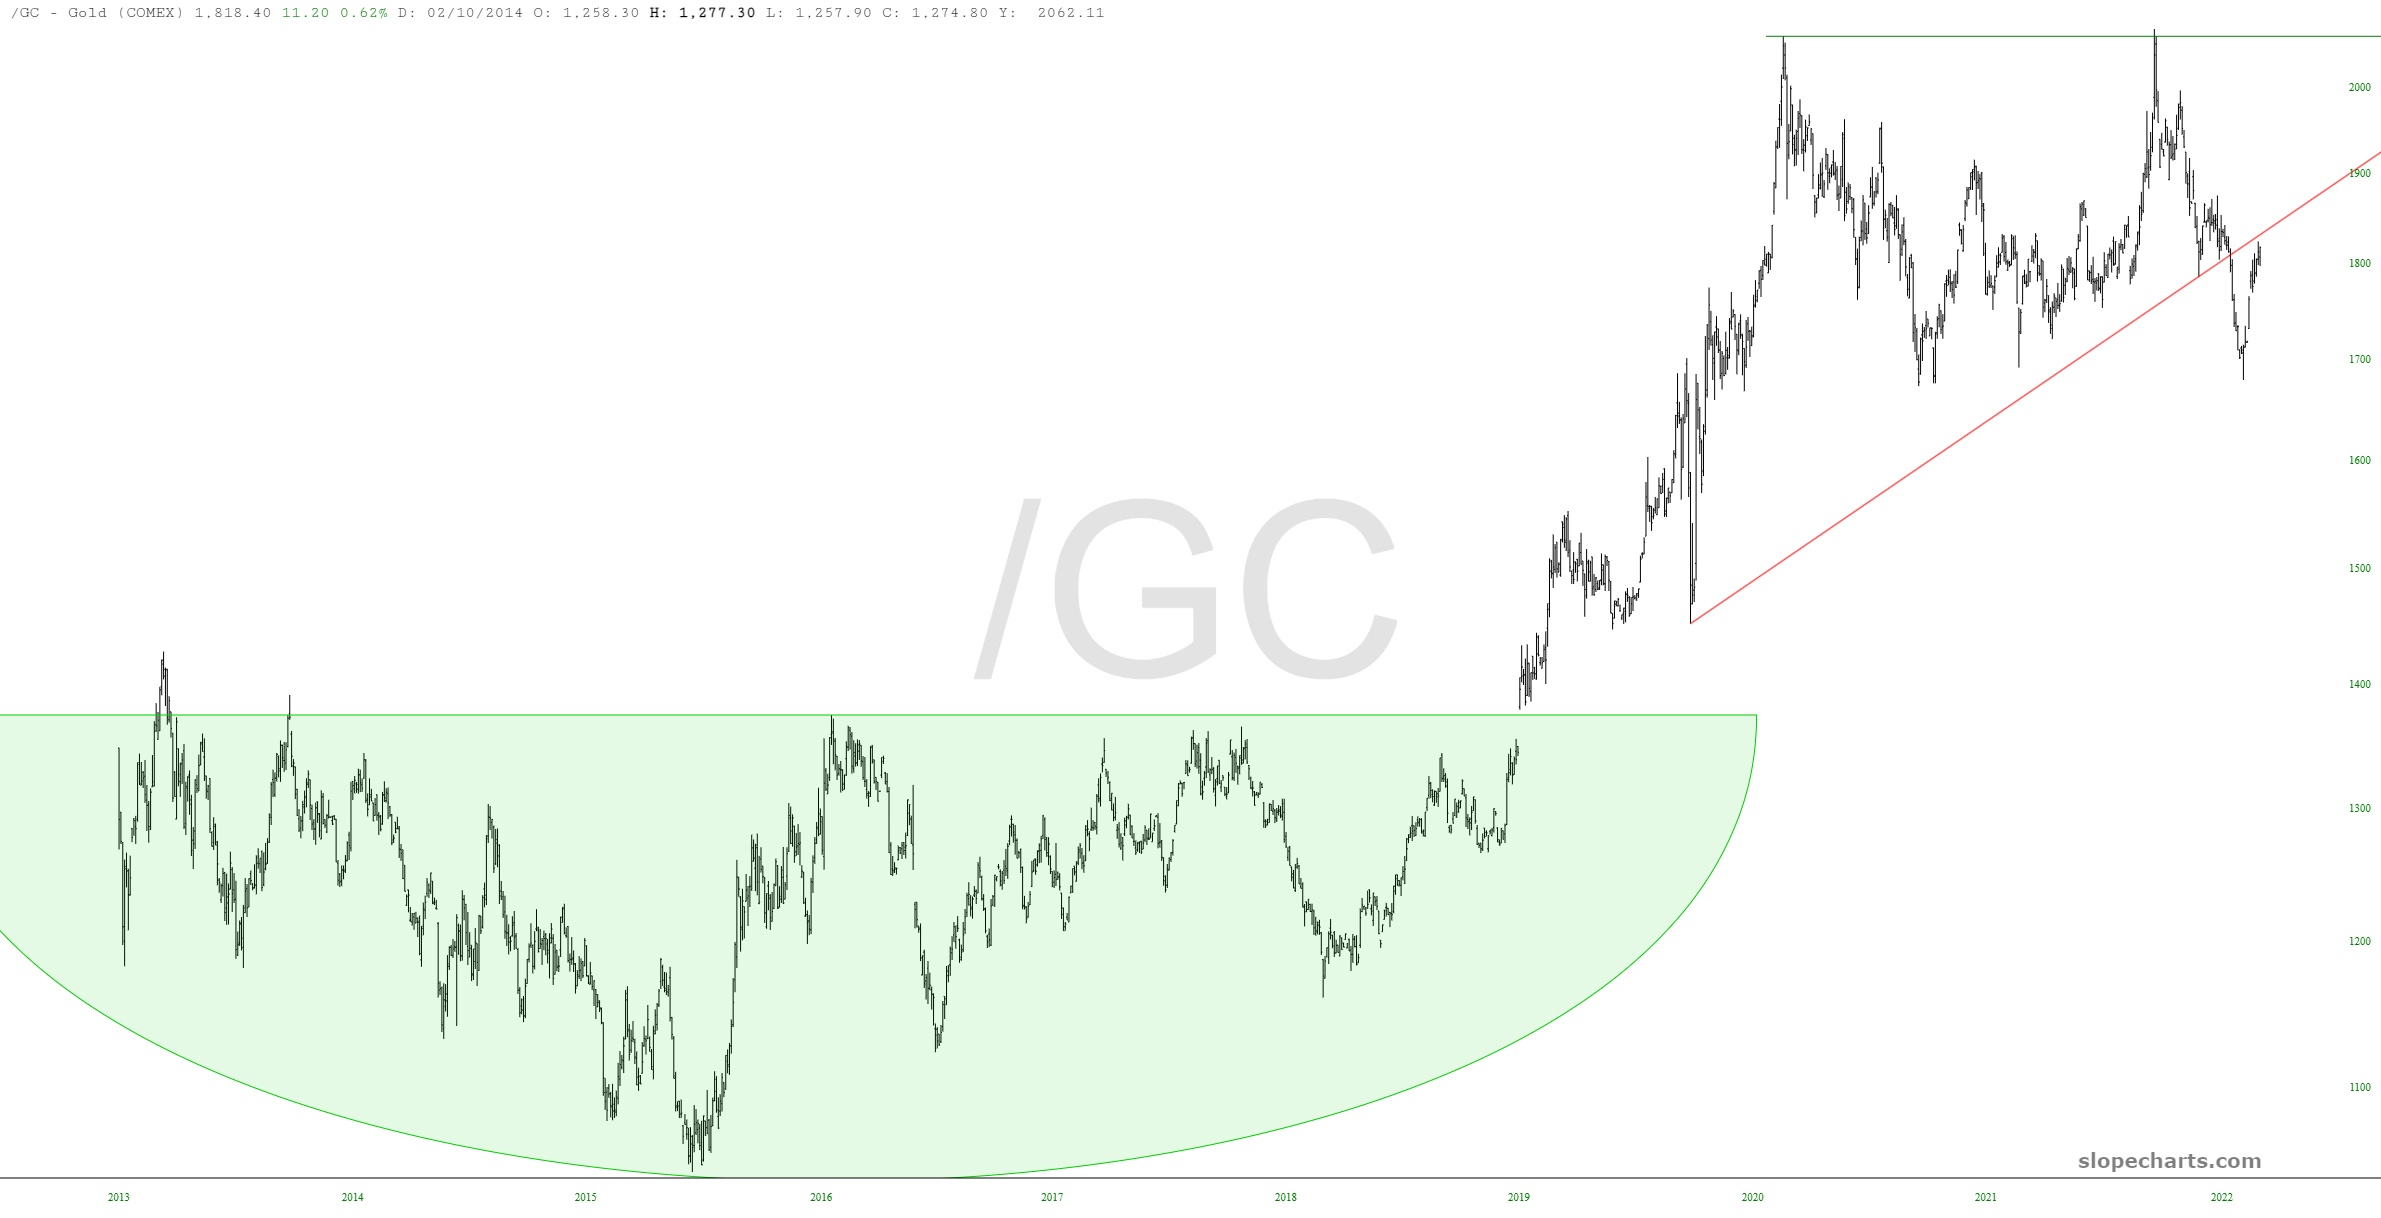
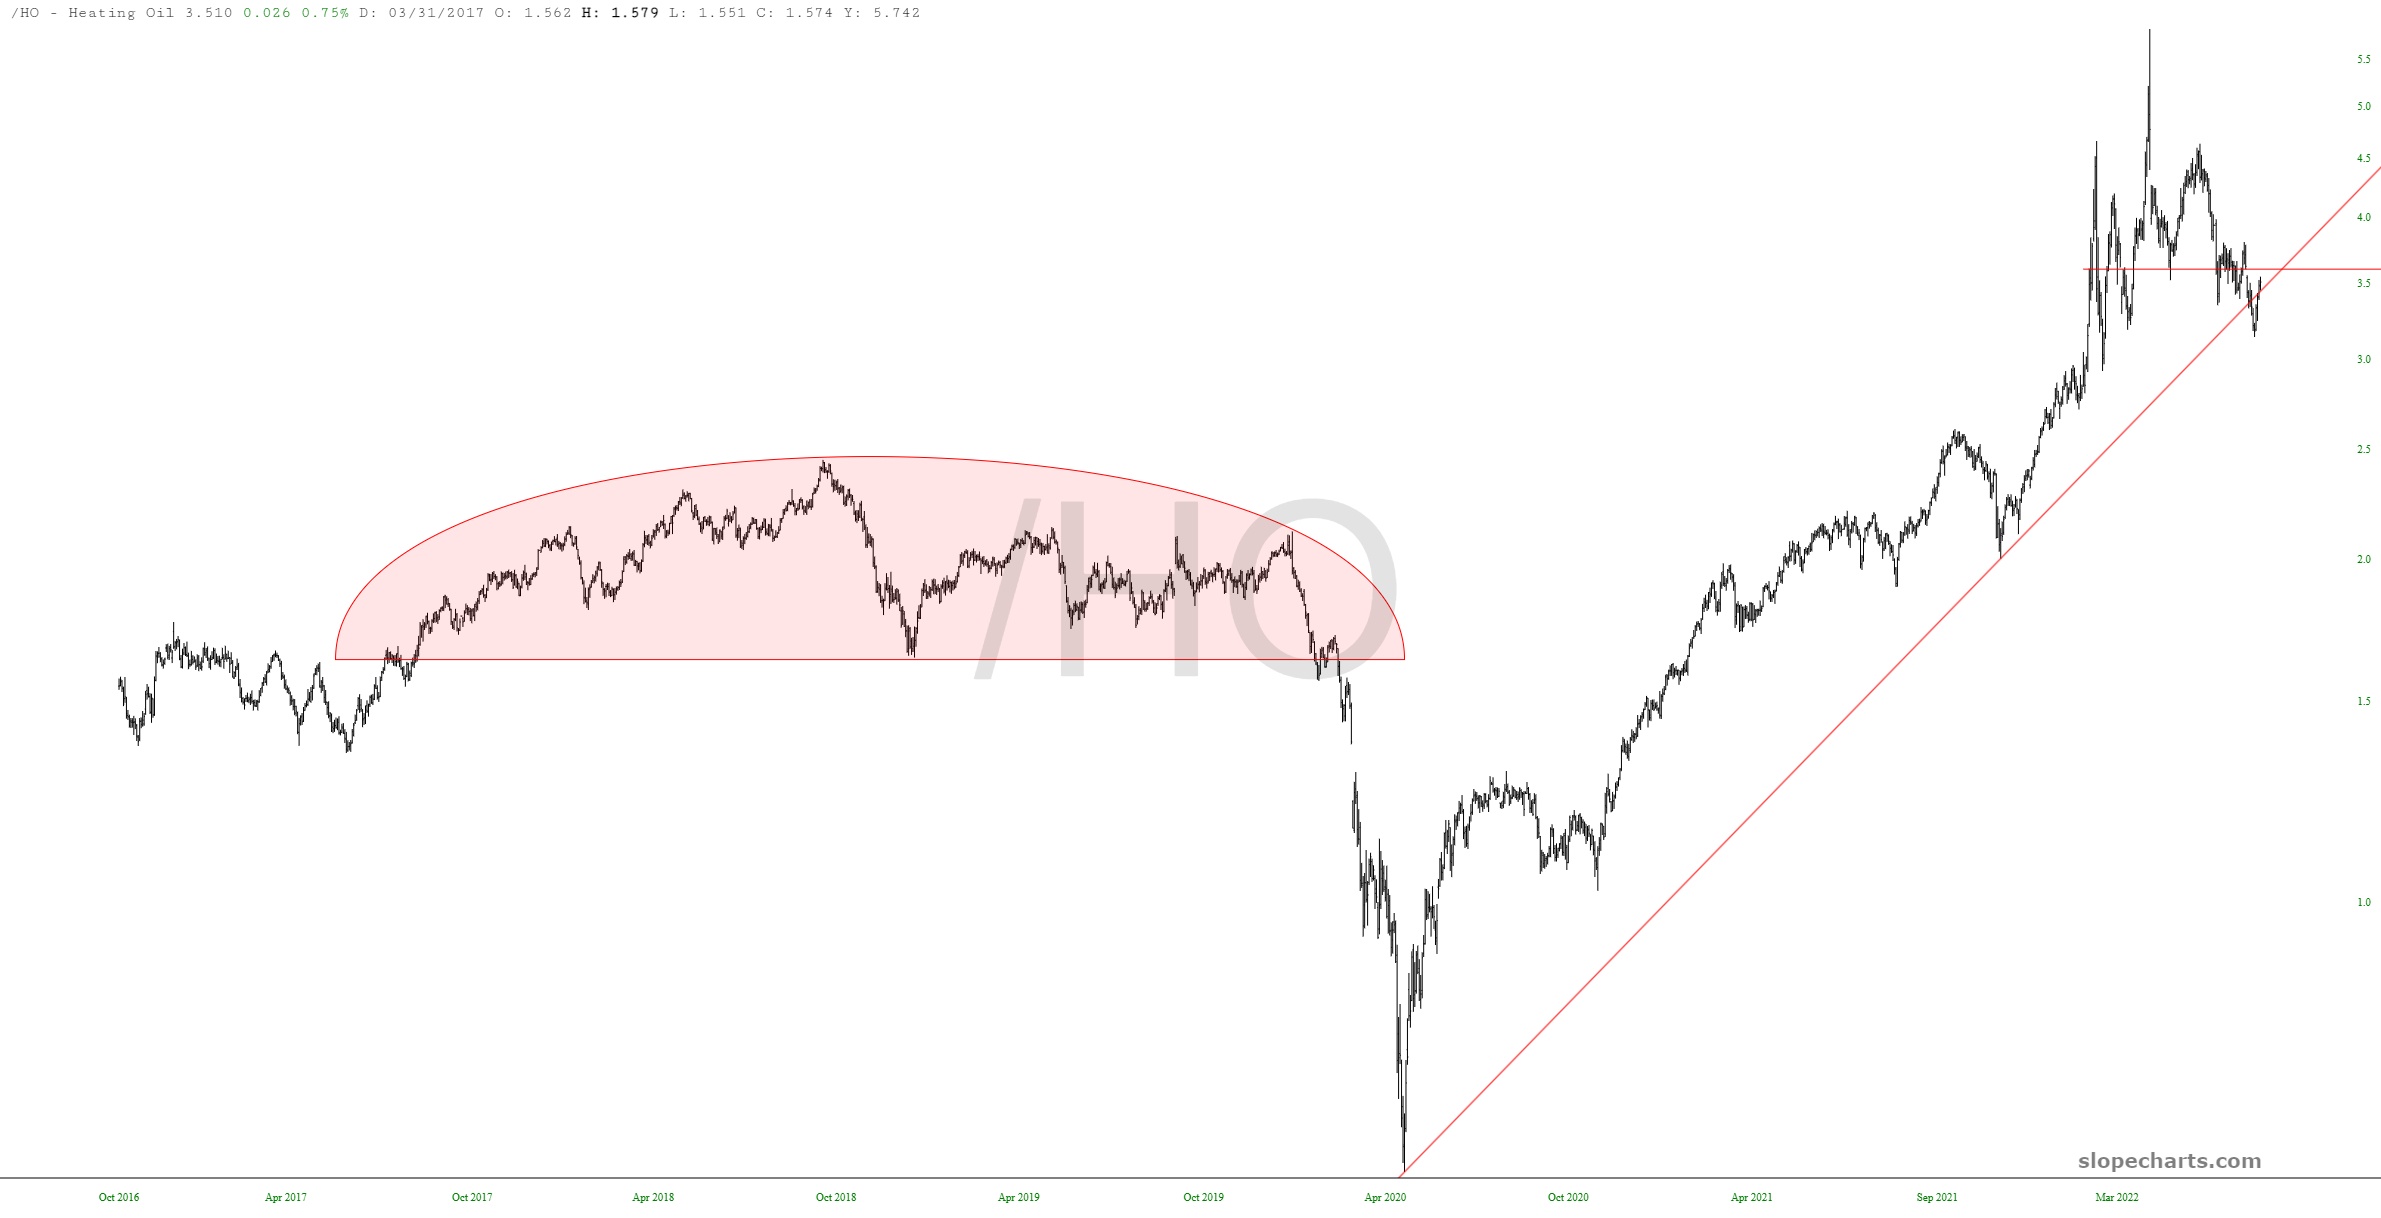
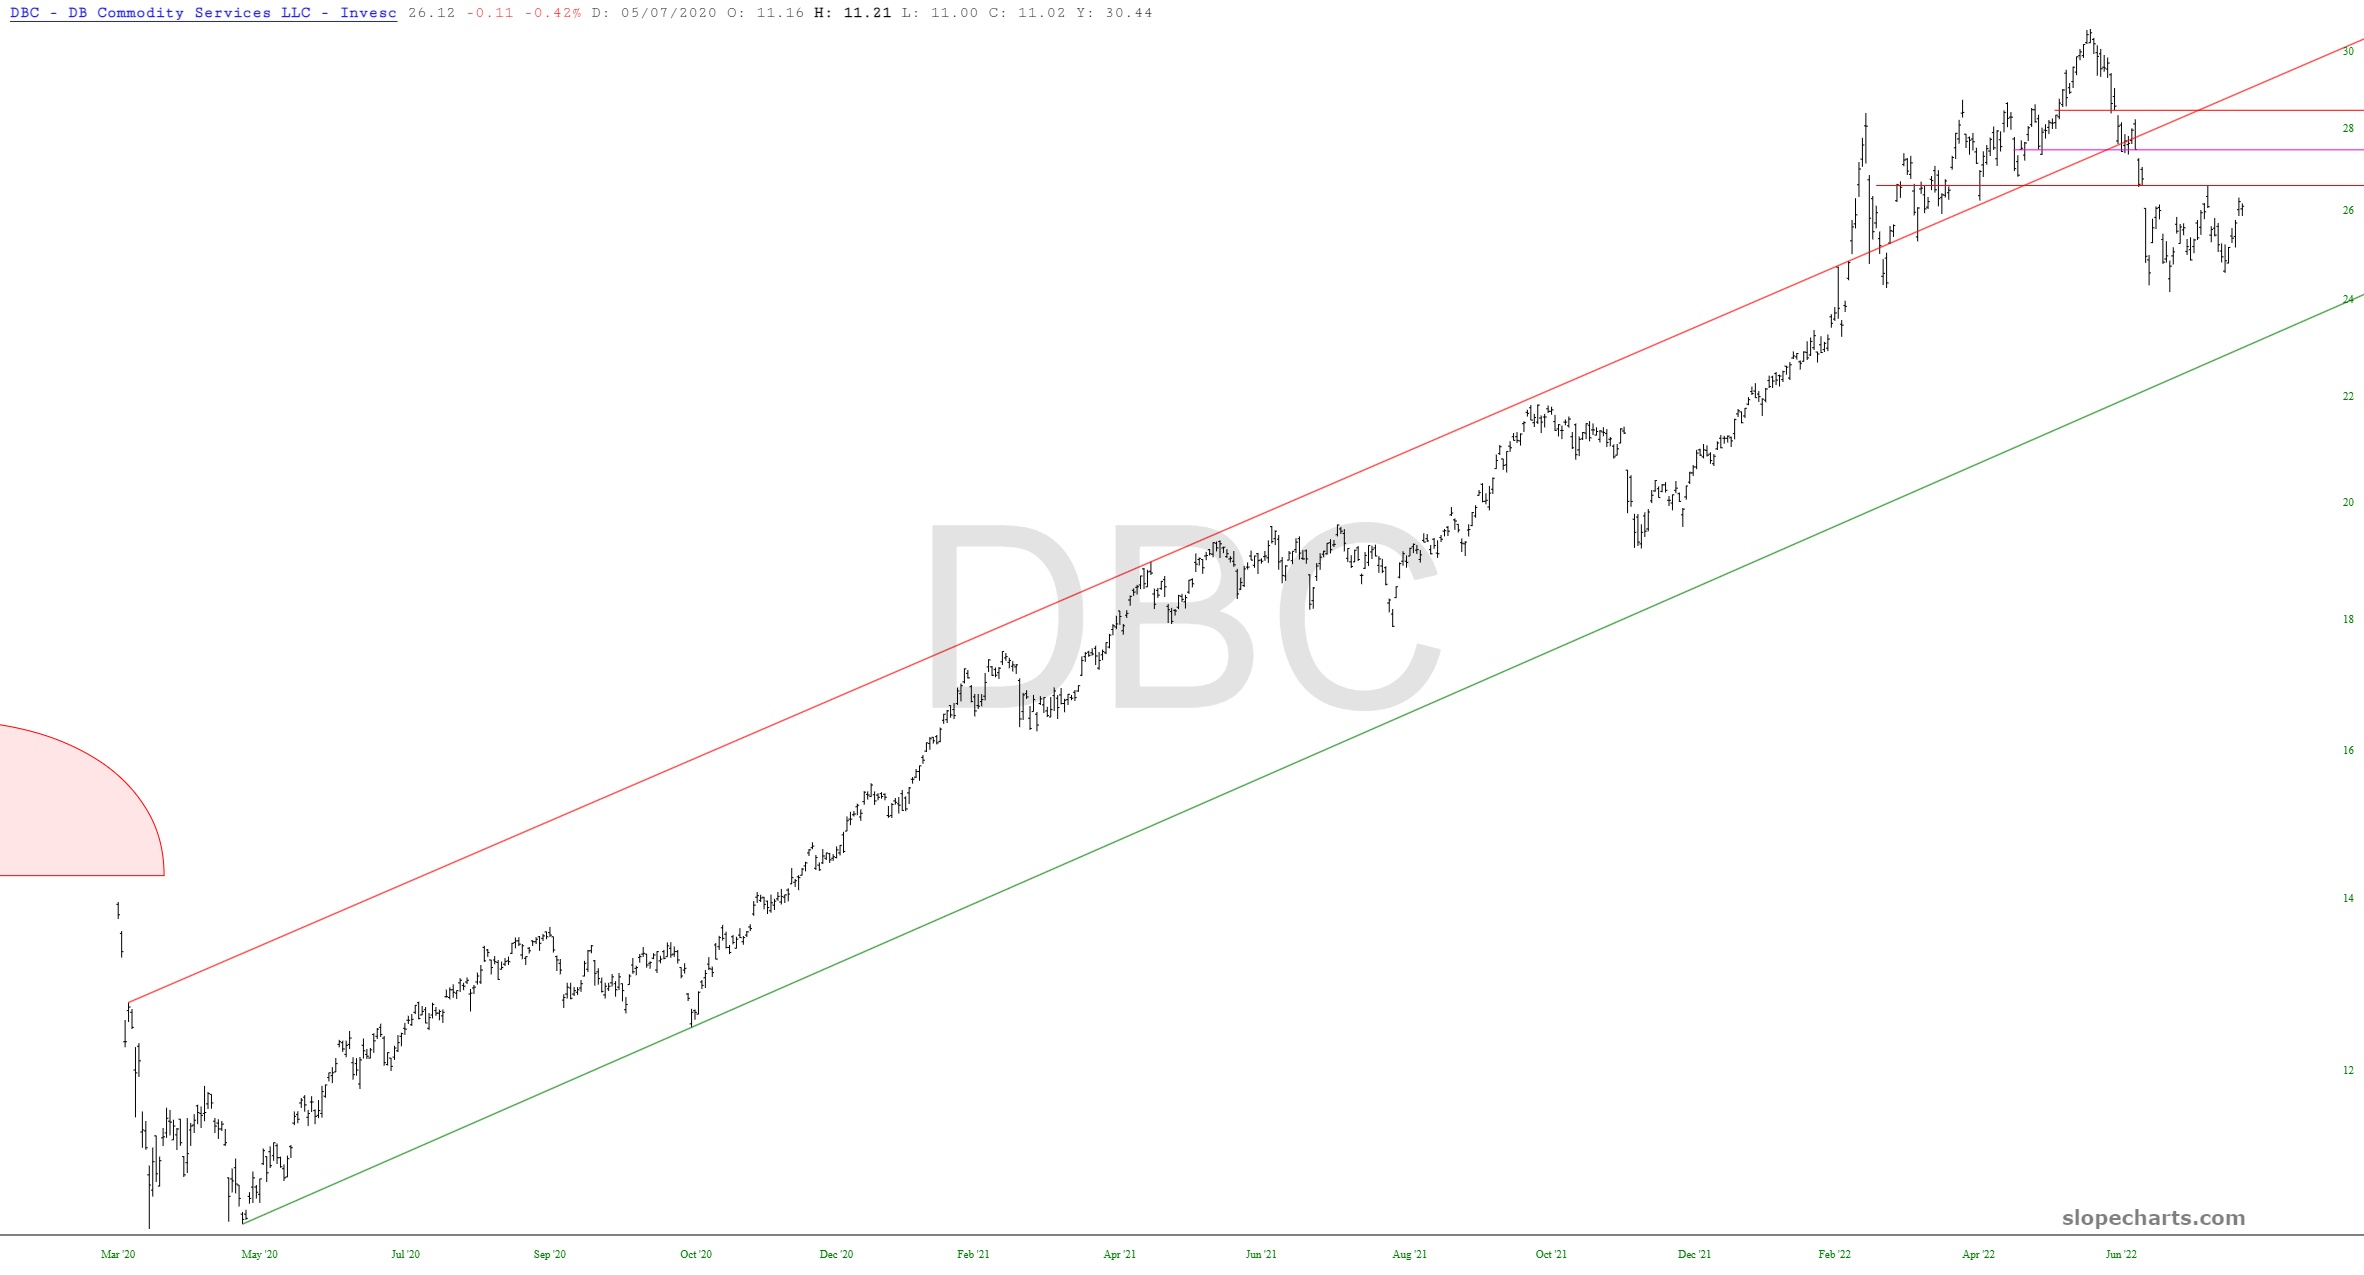
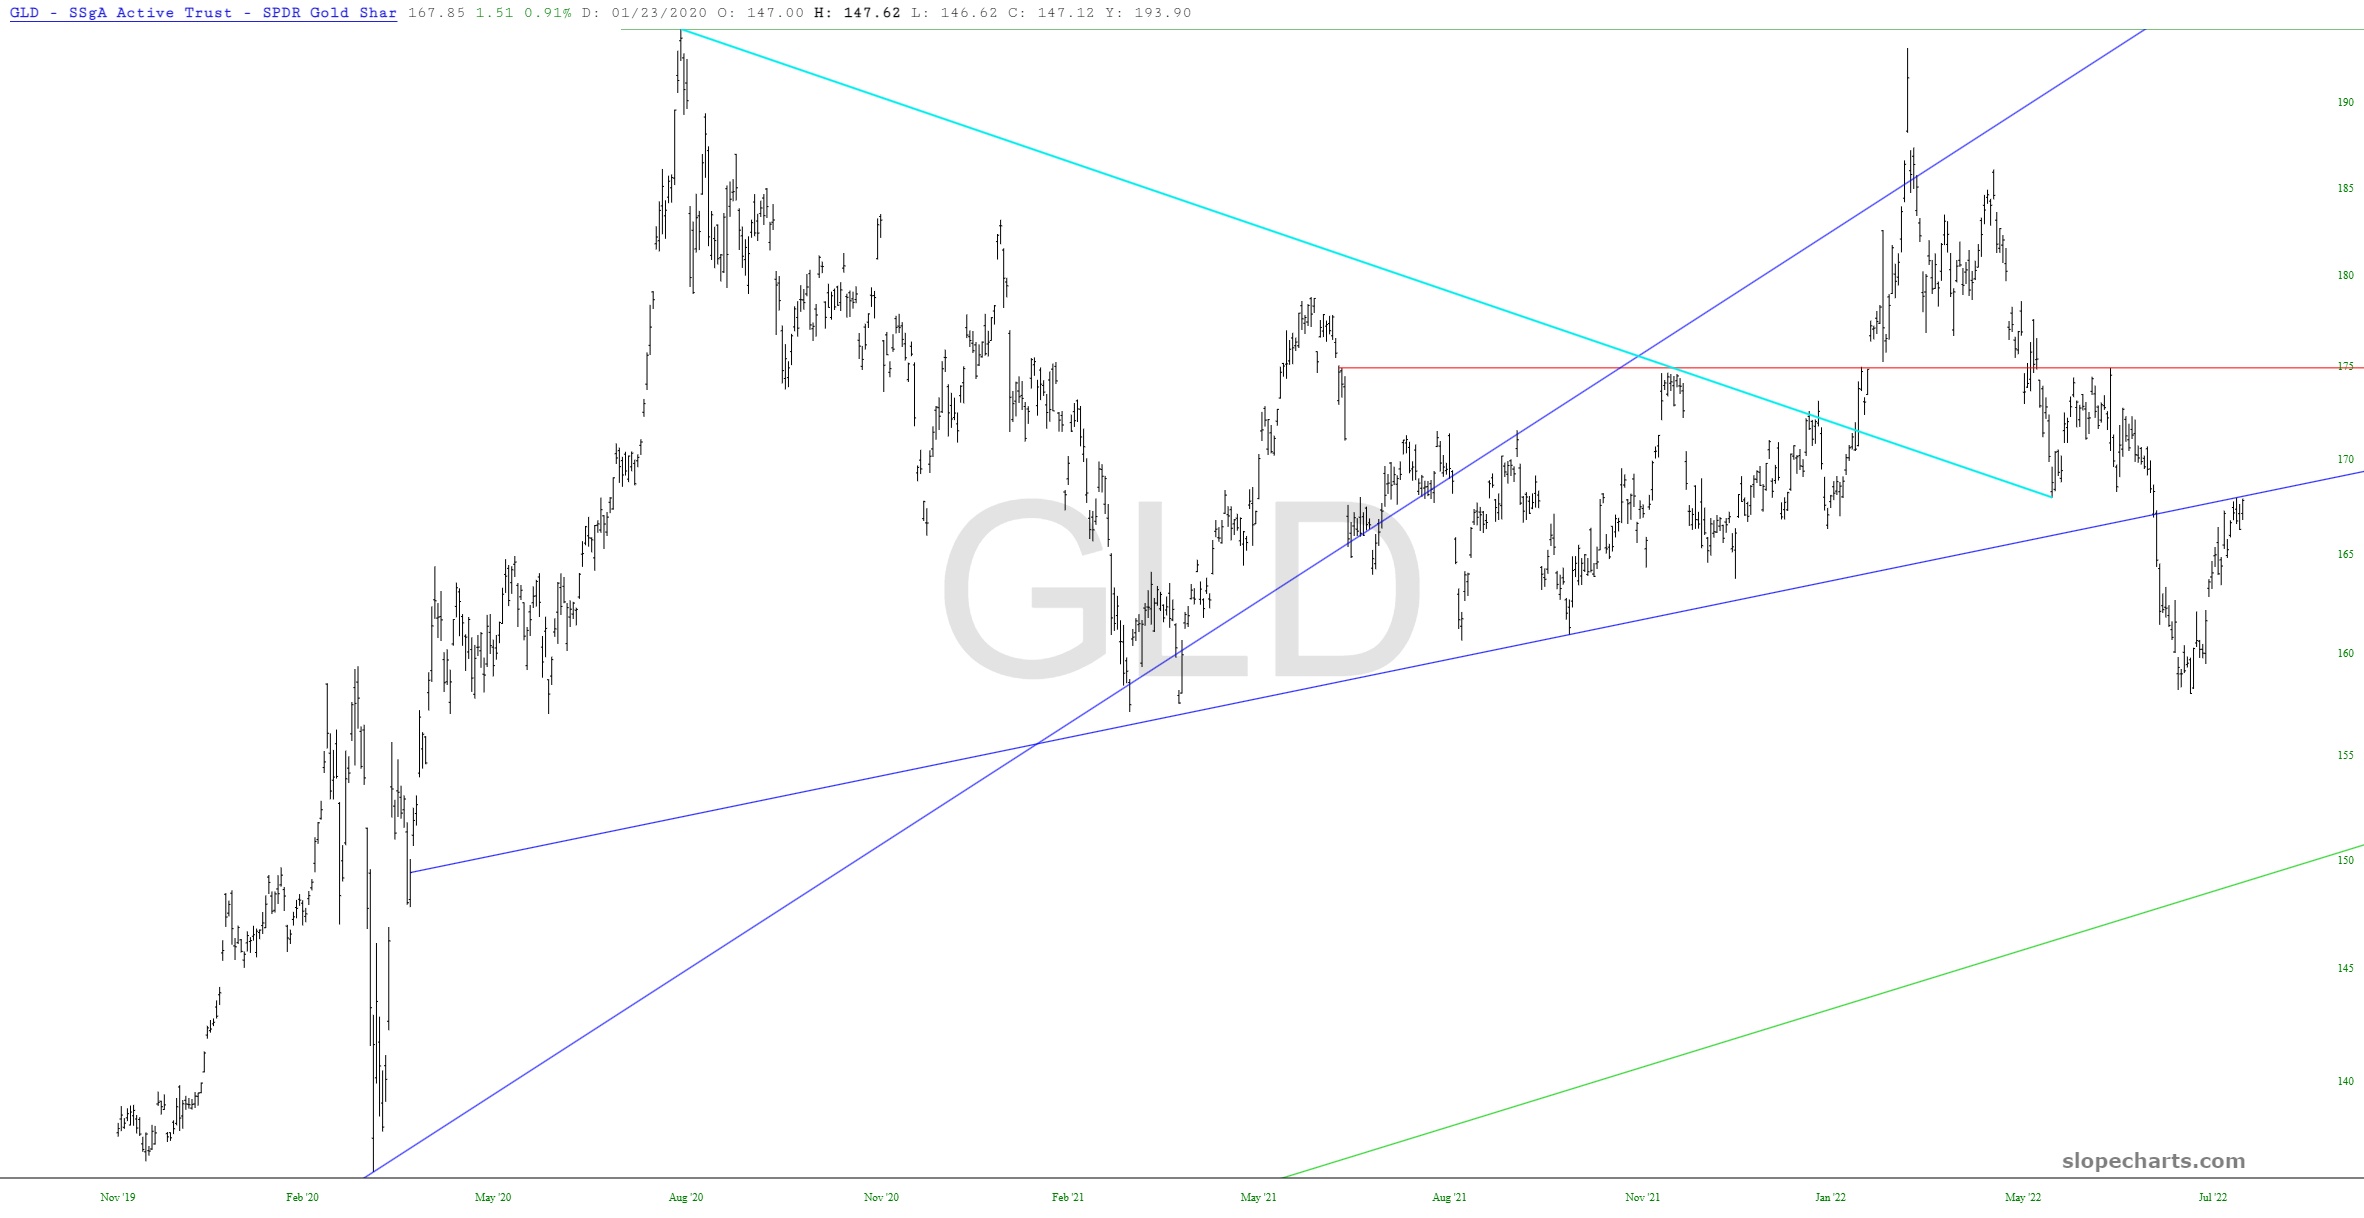
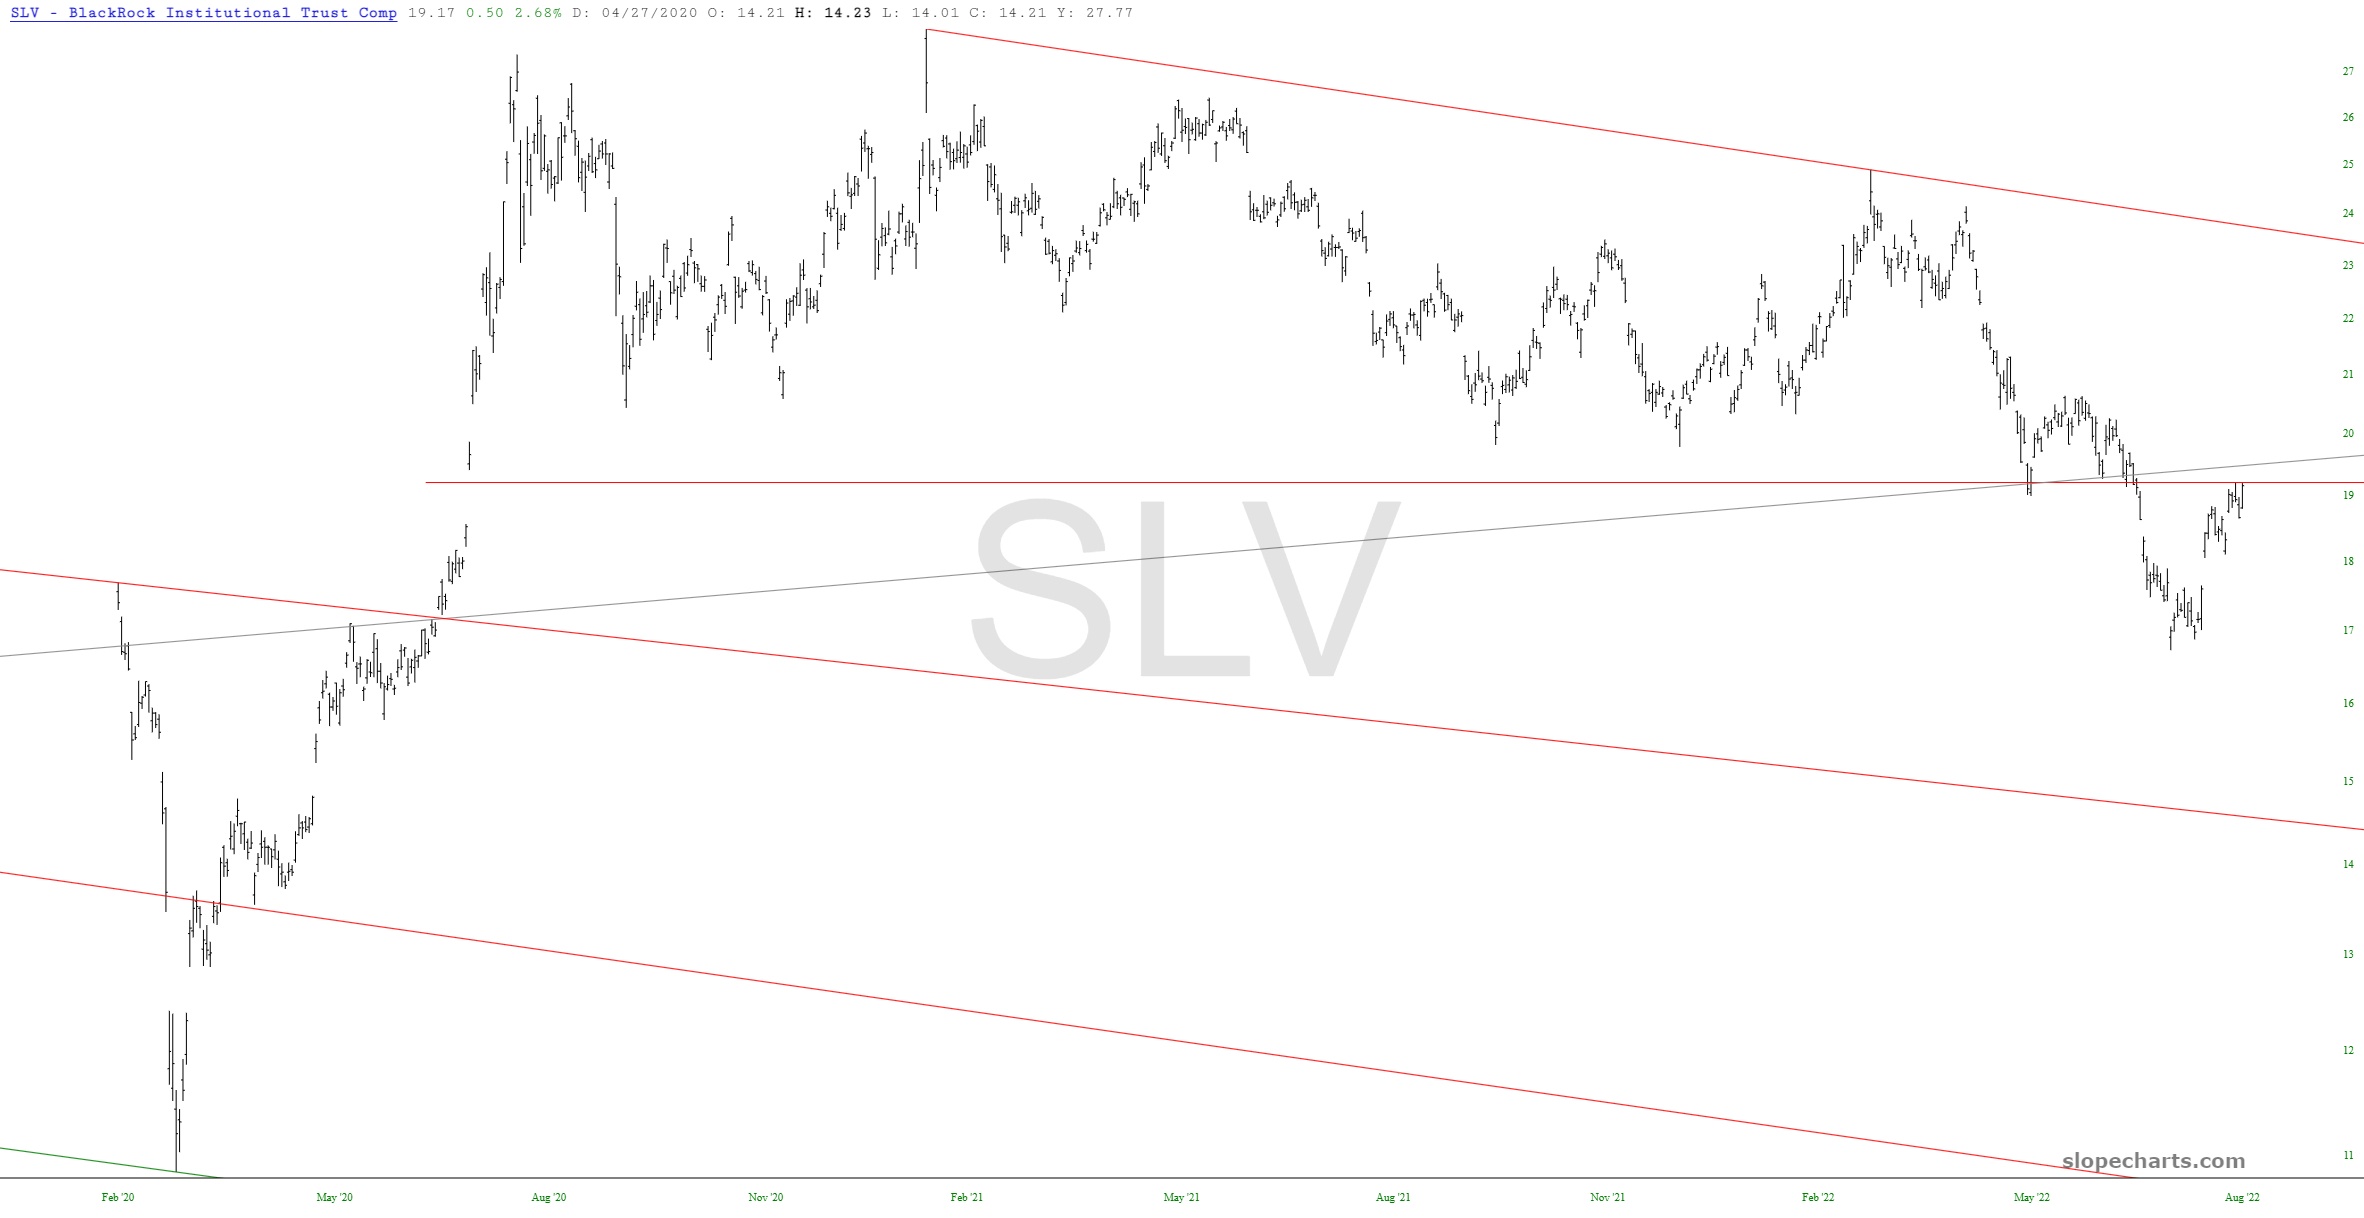
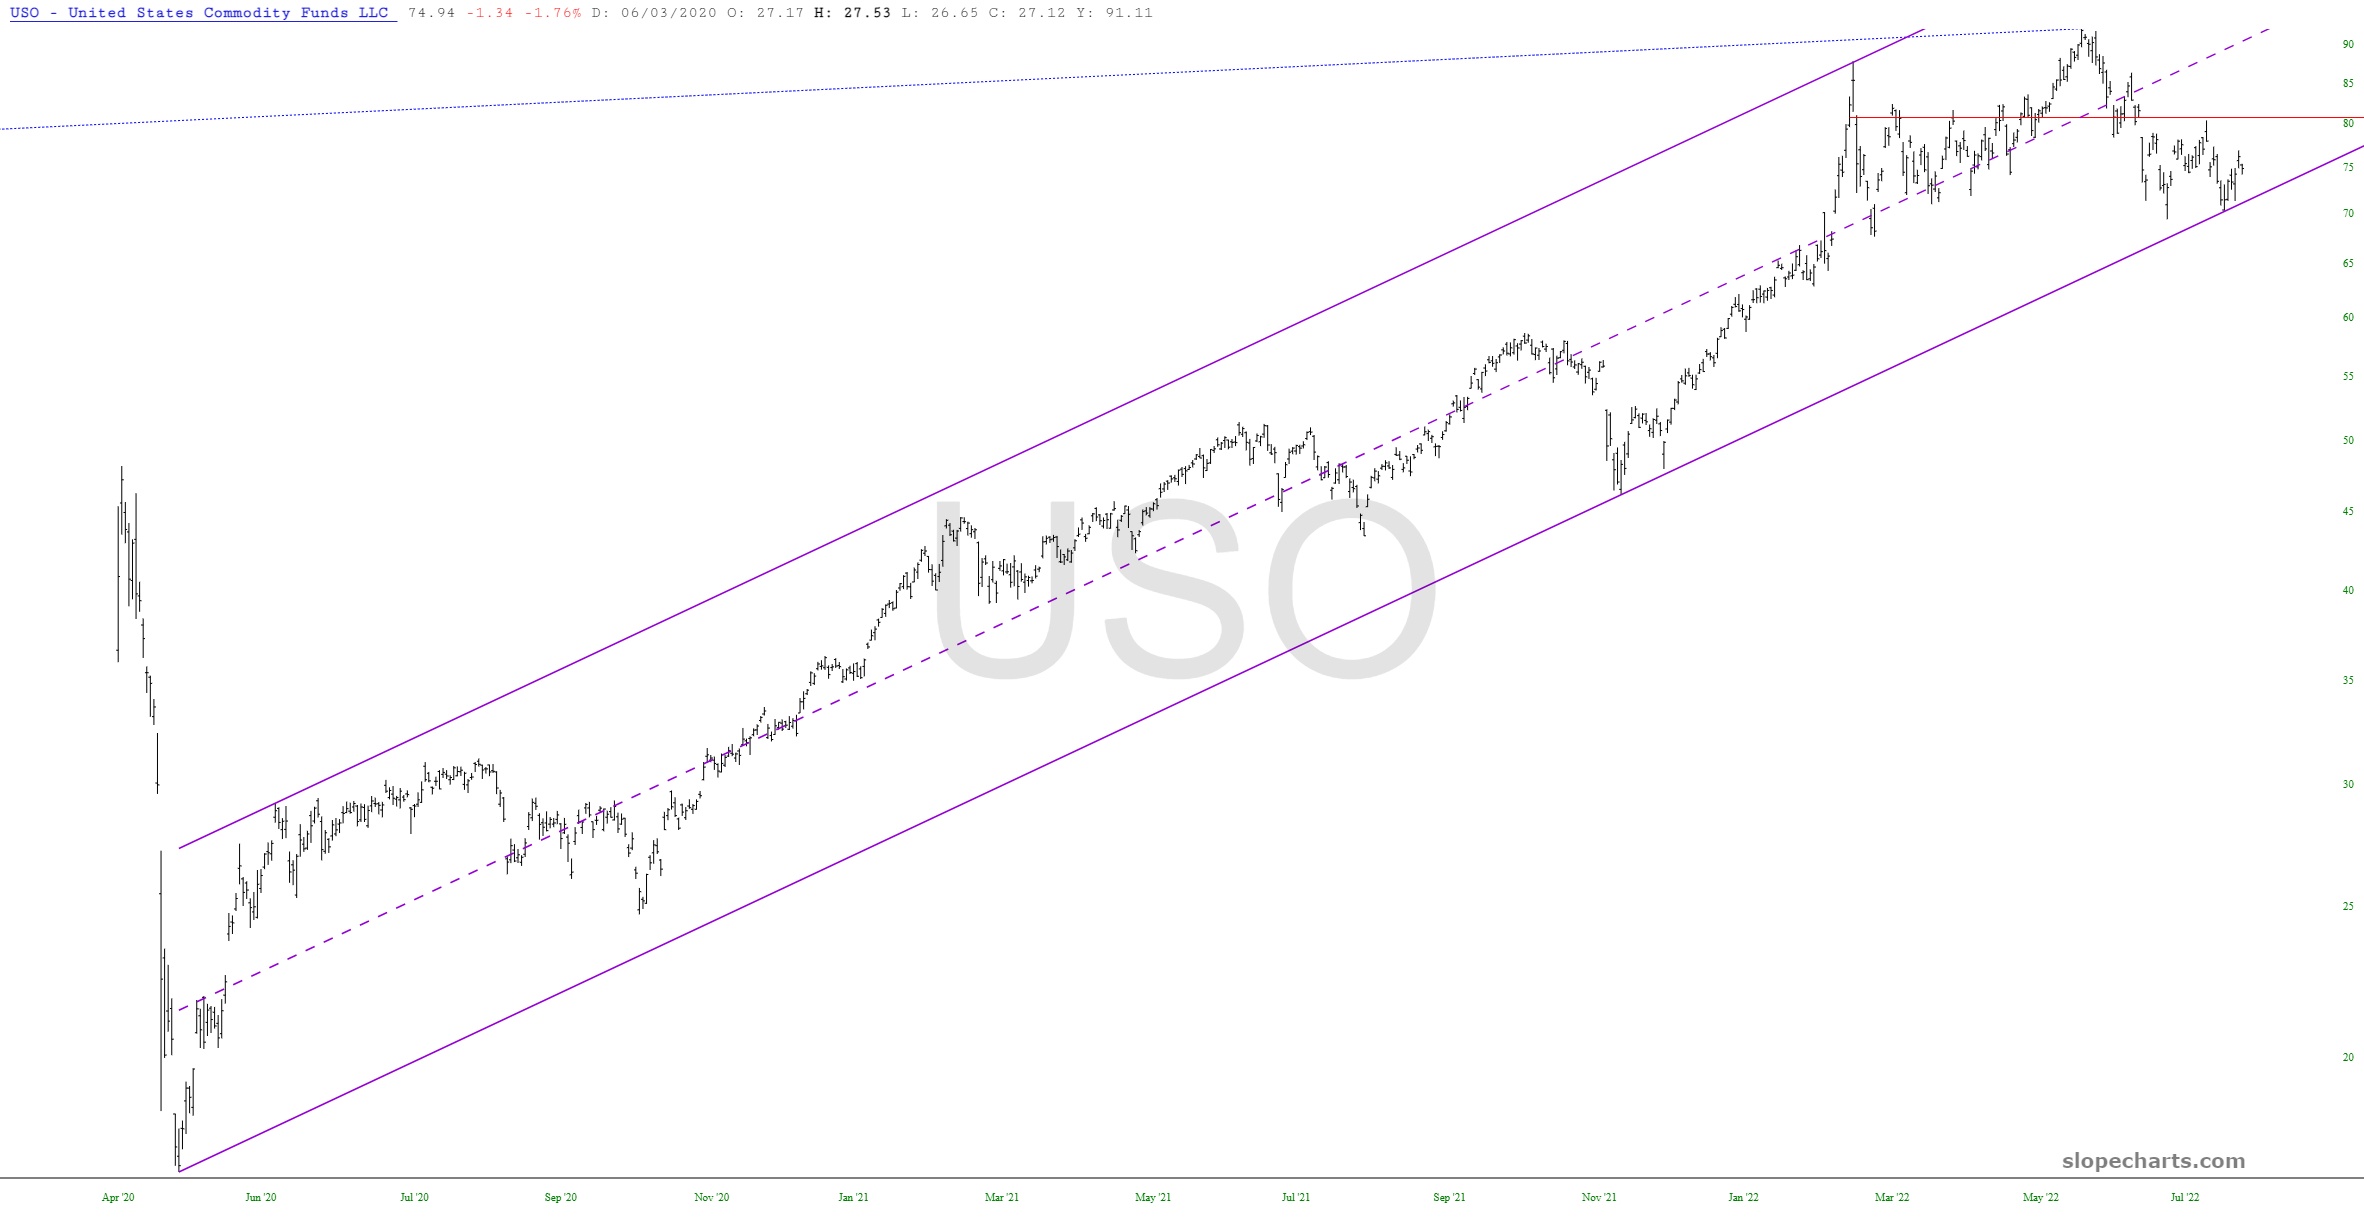
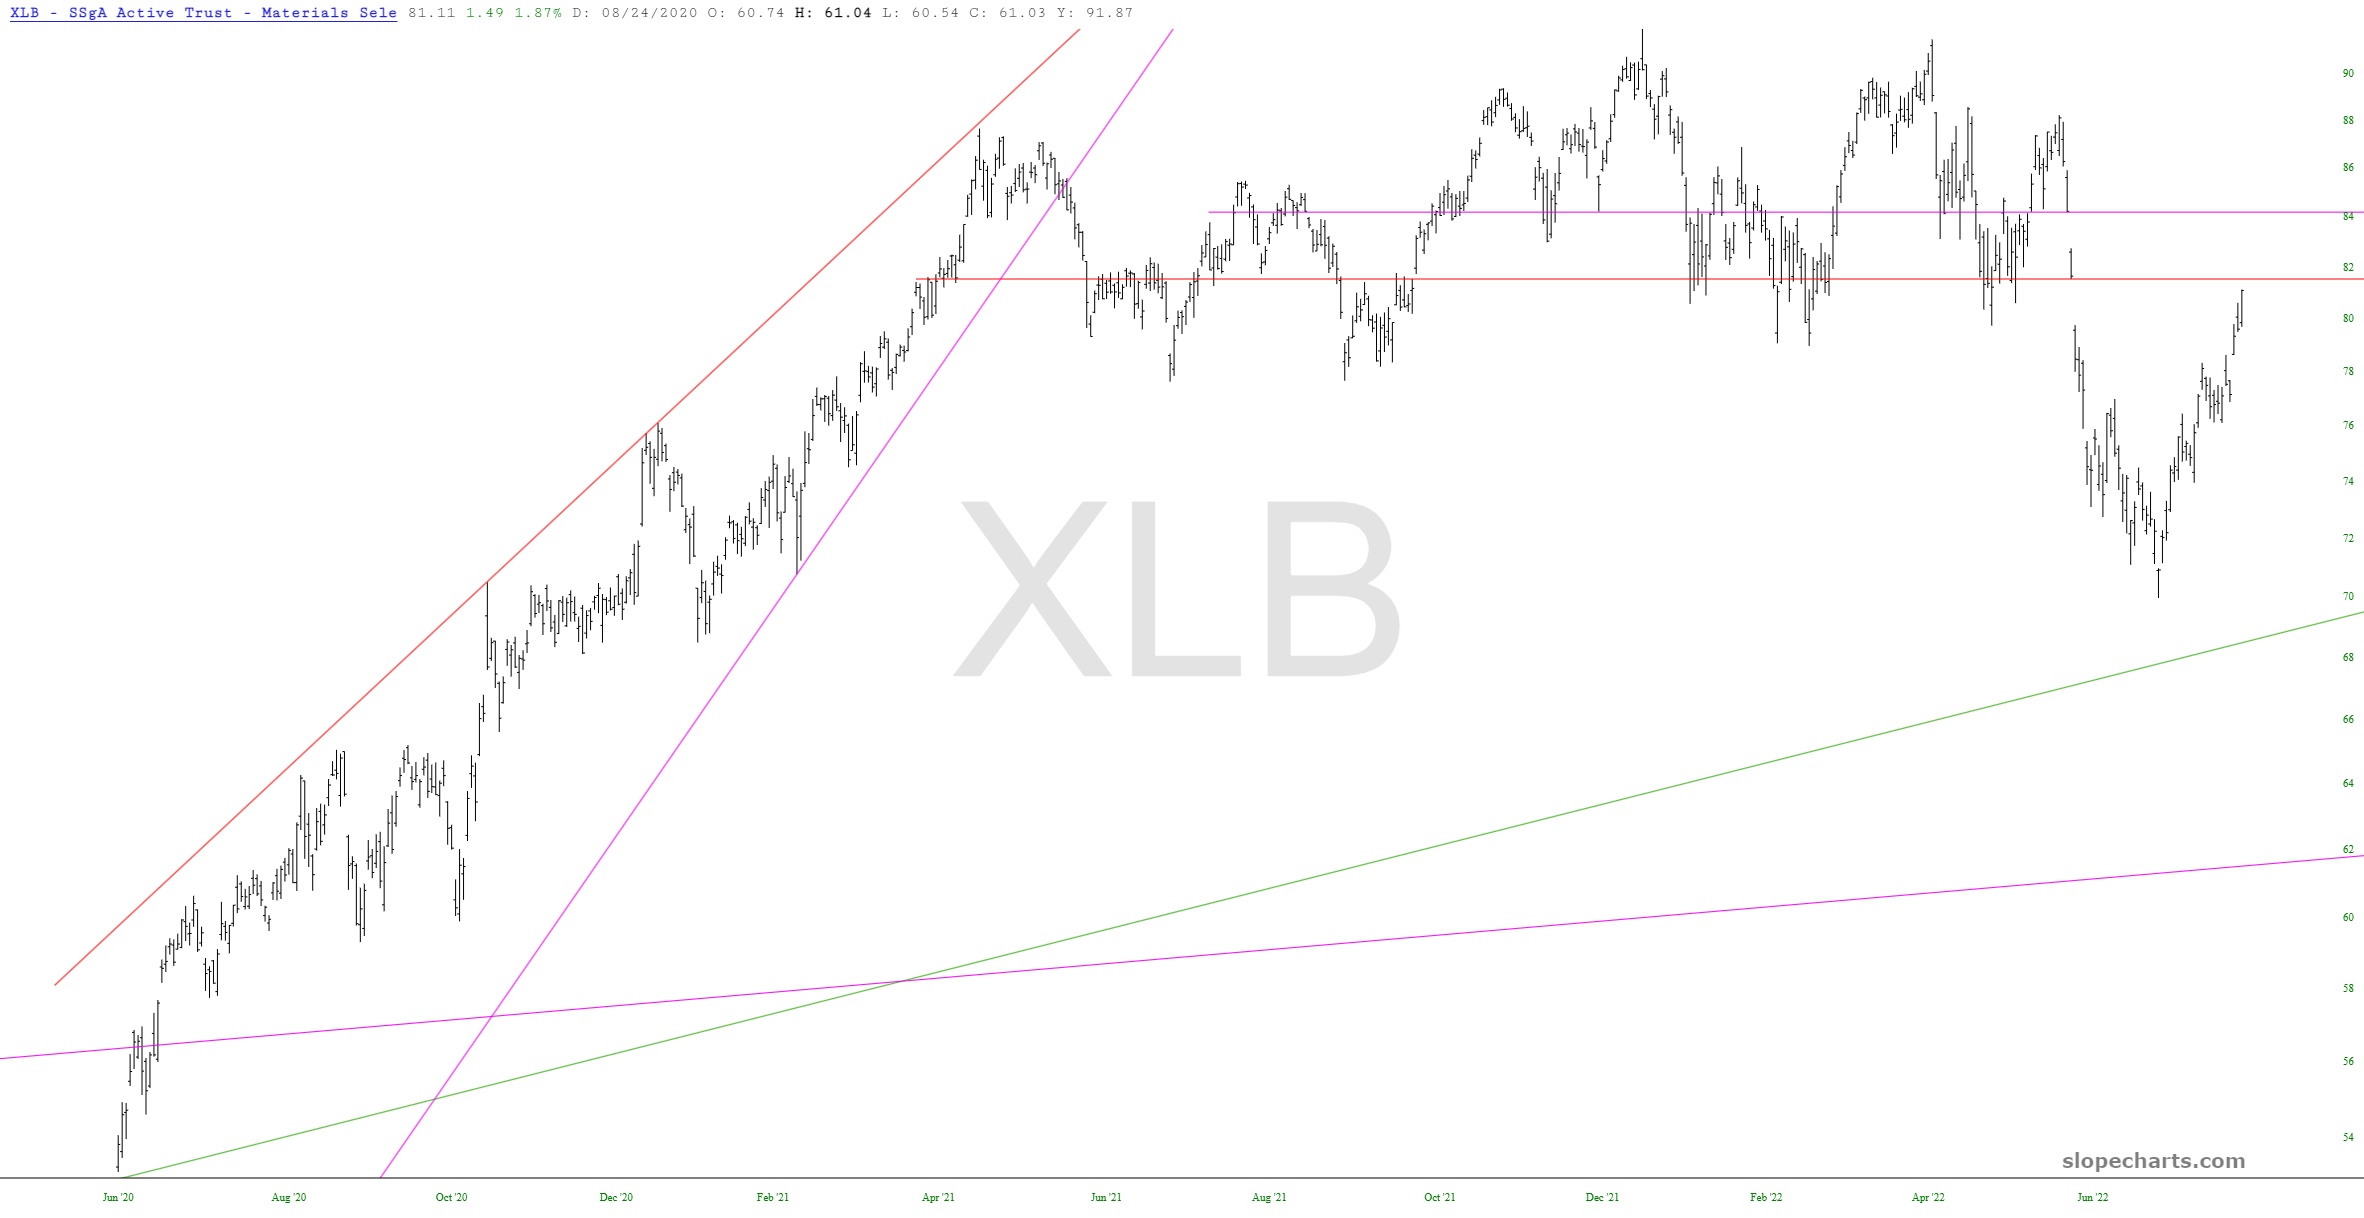
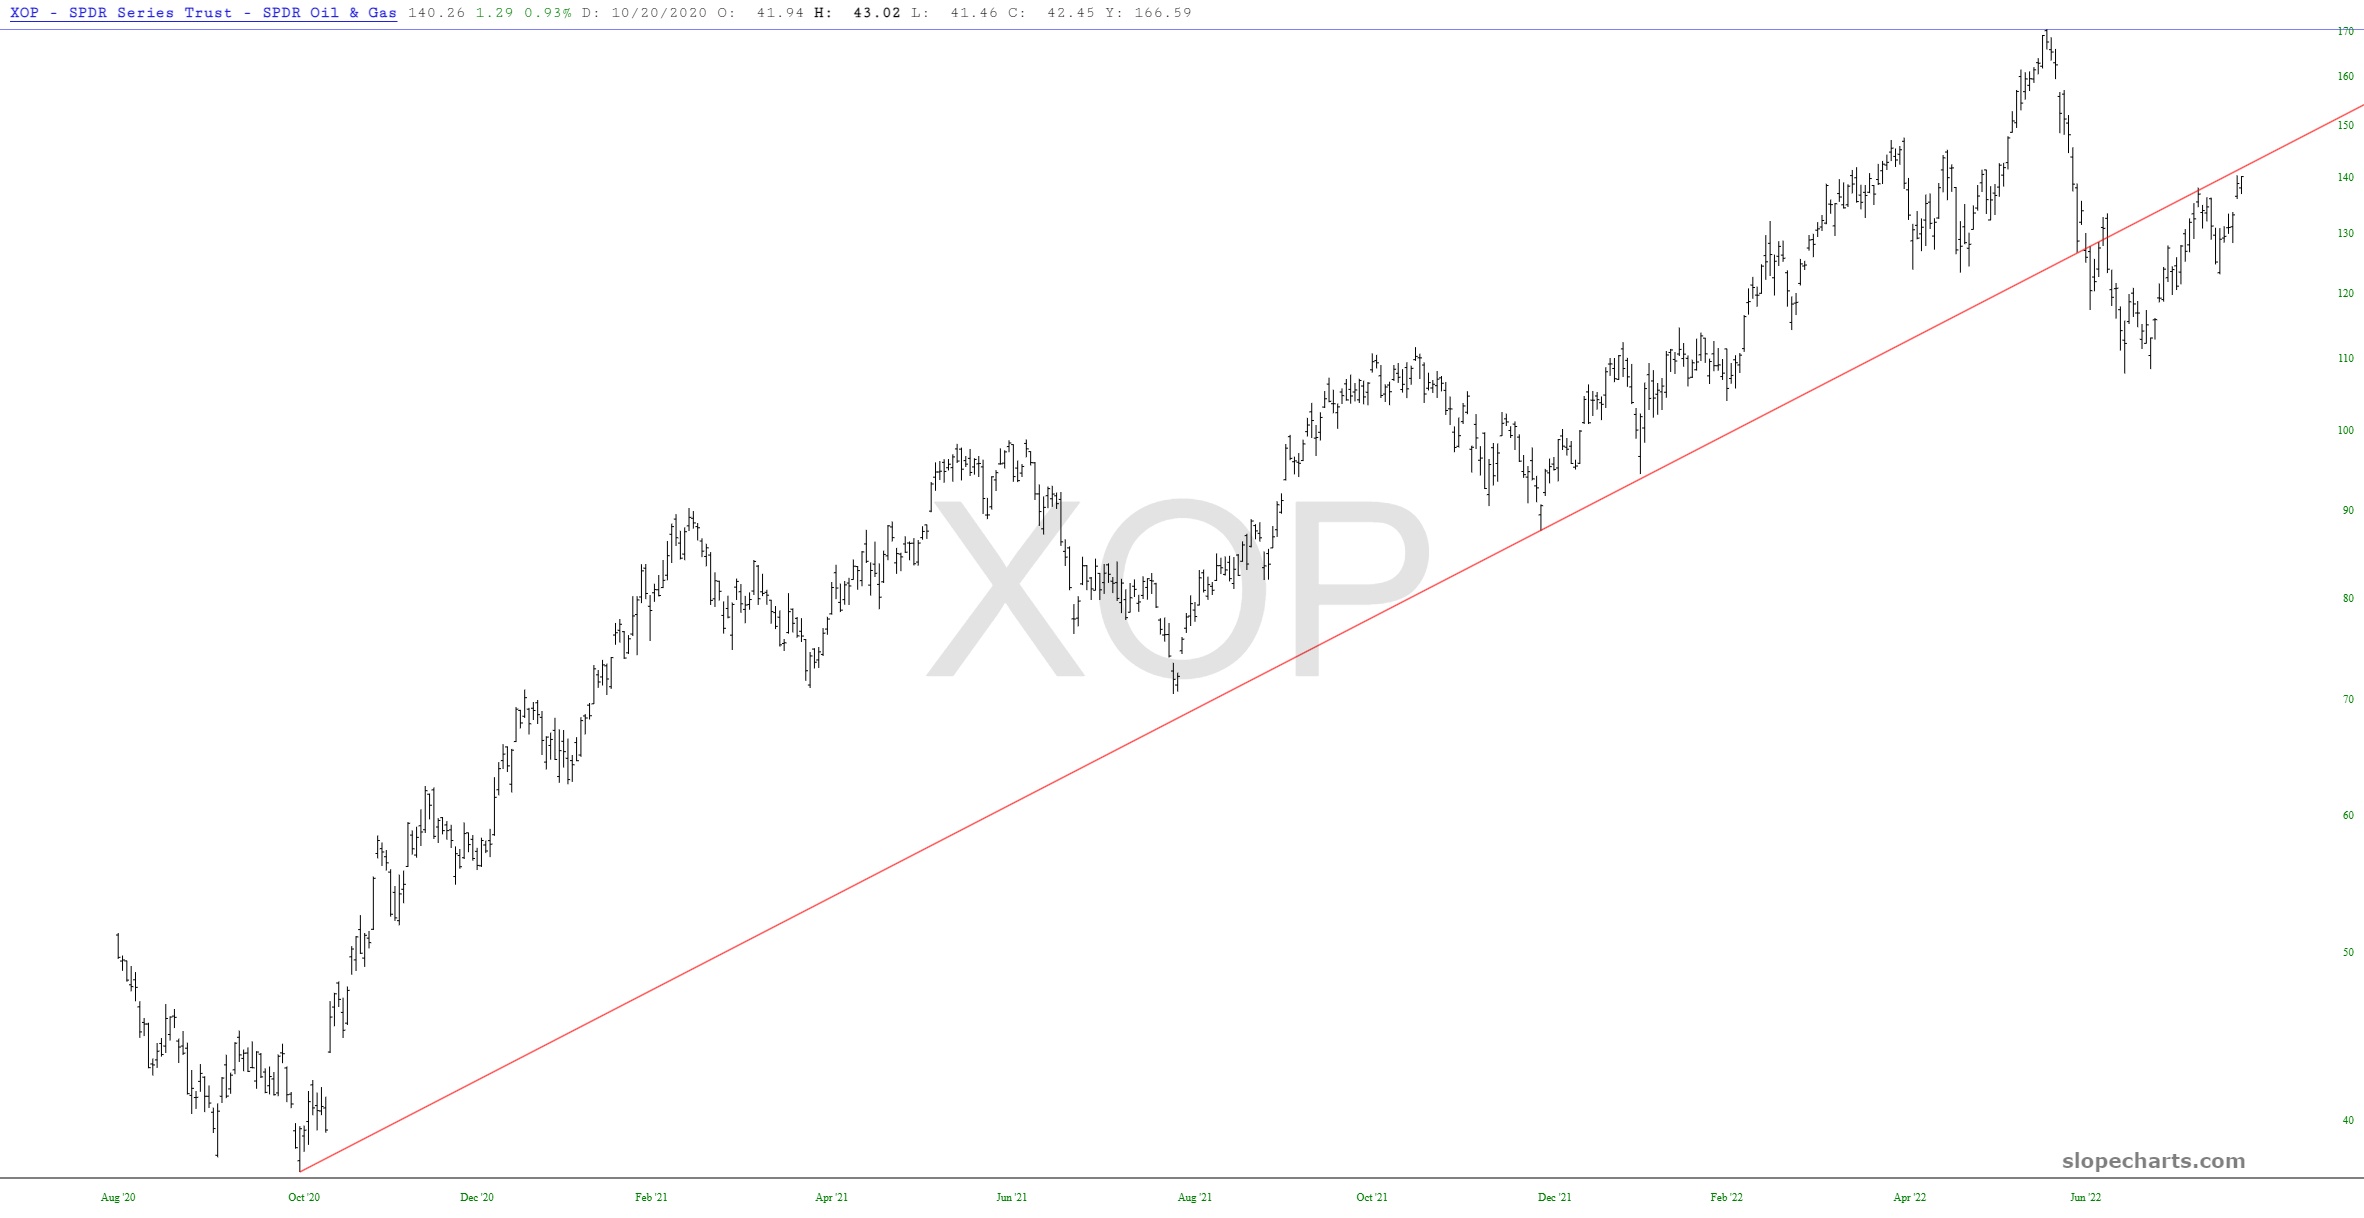
Crude oil still looks poised for a hard fallI think gold is busted and ready to fall with all other assetsHeating oil has a clean gap and is about to break its uptrendThe commodity fund is in good shape as long as it doesn’t push above the horizontalThis is rather redundant with /GC but just so you get the ideaSilver’s right triangle pattern also bearishIf we break this channel, it’s bombs away for energyMaterials needs to stay under the lower horizontalThis got dangerously close to wrecking its failure, but the broken trendline is still intact