
With all respect to Al Pacino and Keanu Reeves, we traders find ourselves in a very interesting ‘Devil’s Advocate’ situation following Thursday’s CPI dump and pump.
A good ol’ bulls vs. bears mental match.
The bulls’ case received a few key boosts:
- Our dear bear leader’s 3500 SPX target being tagged, bagged, and bounced off of.
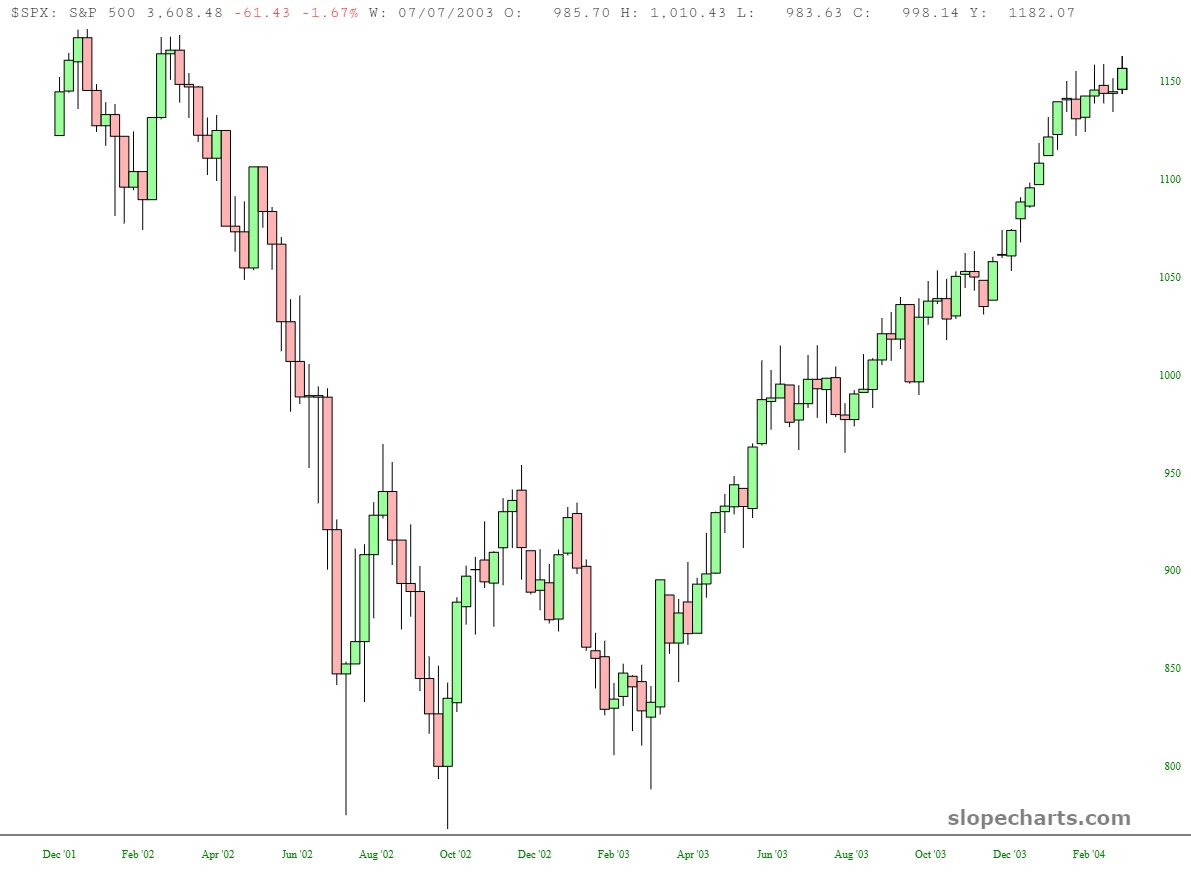
Note that that 3505.24 level on SPX marked a 50% retracement of the move up to a new all-time high from the COVID low.
- A poignant series of prior historical impacts from trading legend Larry Williams, as first pointed out to Slope by The Director during Thursday’s brouhaha.
The link above is to the full video. Here’s the short version:
a. Years ending in “2” typically begin bull markets since 1932, often with a bottom the in 4th quarter kicking them off
b. 6.5 year ‘master inflation cycle’ shows a cyclical high has already happened
c. Stock Market dominant cyclical pattern shows an October low since 1950. Mr. Williams cites a 77% historical showing of a higher move, twice a push, and twice wrong (2018 most recent wrong)
d. Cycle unity for stock market as the short and long-term cycles from 1950-2022 are both in agreement for a cyclical low in October, and a bullish push into February of the following year
e. Using a projection forward method of crude oil prices, stocks should rally and interest rates should fall
f. Using a discount P/E valuation formula for the DJIA, stocks should outperform the long-term average from this point forward
g. Election seasonal pattern shows bottoming just before Election Day in November, and an historical bullish edge of buying on the 21st trading day of October (which would be Oct. 31st this year)
Larry’s conclusion: Long stocks, long bonds, and short inflation.
To note, Williams publicly stated he was short-term bearish on September 9th.
And in that video, he pointed out a special interest rate inversion that showed a high degree of accuracy in predicting bullish turning points based off FRED data, which predicted an October bottom.
- The Dollar Index (DXY) is at highs not seen since near the end of the dot-com bubble in May 2002. And typically a bearish dollar is bullish for the large-cap indices (Russell is a special case due to where smaller businesses historically receive a majority of their revenue).
Five months later in October 2002, the SPX bottomed, and began the post-dotcom crash rally into the housing bubble.
- Divergence in the Bullish Percentage Index with price action
As pointed out daily by Sloper Sleeperlon during the trading week, there is a major reversal indicator based on point and figure charting called the Bullish Percentage Index or BPI, available for free through StockCharts.com.
We are seeing bullish divergences on the indicator versus price action on SPX and NDX, while both indicators are beneath their 20-levels.
Now to the bear case:
- Interest rates are moving higher globally, and members of the Federal Reserve keep speaking about the threat of inflation and need to increase the Fed Funds Rate.
Higher interest rates are typically bearish for housing and the stock market.
And this move higher in global interest rates is coming from an all-time low, and in some cases negative rates (looking at you Europe).
Adding to the interest rate case, as pointed out by Sloper TnRevolution, TK’s fellow chartist Tom McClellan showed no bullish signal from bond-related closed end funds.
- Bulkowski on bullish engulfing candles
So everyone noticed that post-CPI rally created a major outside bullish reversal engulfing candle on Thursday.
But the king of candlestick pattern statistics himself, Thomas Bulkowski, notes the ‘dreadful’ performance of the pattern in the following:
“The bullish engulfing candlestick, at first glance, appears to perform quite well. It has a reversal rate of 63%. That means price closes above the top of the candlestick pattern 63% of the time. The bad news is that with an overall performance rank of 84, the post breakout performance can be dreadful.
A closer look at the numbers shows that downward breakouts are where this pattern outperforms. The best move 10 days after an upward breakout is a drop of 1.18%. Usually you would see a rise 10 days after an upward breakout but not in this candlestick. Thus, if you are going to rely on this candlestick then look for a downward breakout. The best move appears in a bear market, so that is the way to trade this one.
This is also one of the trading setups that I suggest you avoid. Why? Because the primary trend is downward. The bullish engulfing candlestick reverses that trend, but only for a short time. The primary downward trend takes over and price resumes falling.
Trade bullish engulfing candlesticks when the primary trend is upward.”
- Job cuts
So back in August, a survey by PricewaterhouseCoopers (PwC) found that 50% of firms are anticipating a reduction in overall headcount, while 52% foresee instituting a hiring freeze and 44% rescinding job offers. That followed layoffs announced by Best Buy, Ford, Walmart, and others.
Fast forward to this month, and we’re seeing more and more layoffs being announced. Especially in tech land, and that includes this week’s reporting of a forthcoming potential ‘major’ series of cuts by Intel due to sales forecast cuts.
Major retailers and bio-tech like Gap and Amgen have also announced hundreds of layoffs.
And yet the government’s “official” unemployment rate stood near historic lows at 3.5% as of the non-farm payroll report released October 7th.
Ask yourself, how often do major companies announce major layoffs when times are good for business?
- Basic price action
The monthly chart is making lower lows.
The weekly chart is making lower lows.
The daily chart is in a bear trend.
Enough said.
- Moneymiser21’s 21st century SPX leading oil ‘indicator’
Note how each of the major tops in the SPX so far in the 21st century LED THE TOP IN /cl by multiple months.
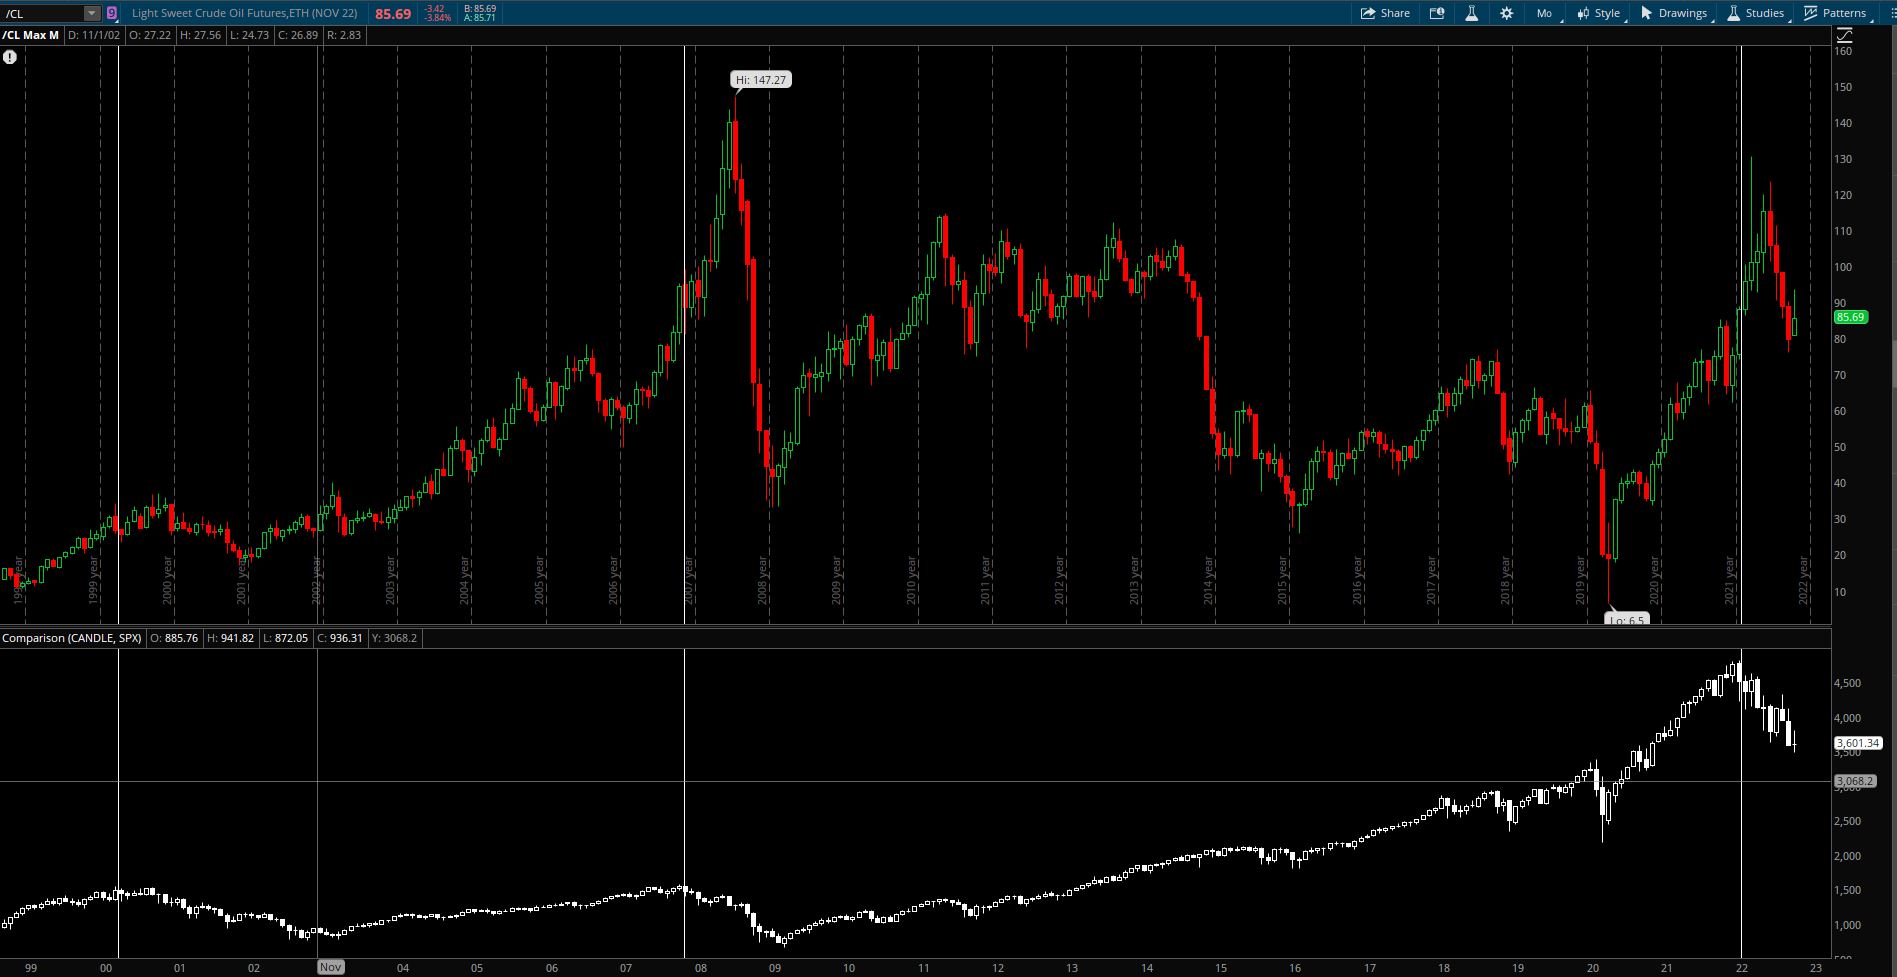
And also notice how long those SPX drops continued.
This lends evidence to the end of economic cycles being driven by commodity price spikes.
Add oil’s typical bearish seasonality pattern courtesy of one of Market Sniper’s favorite timing sites, Equity Clock:
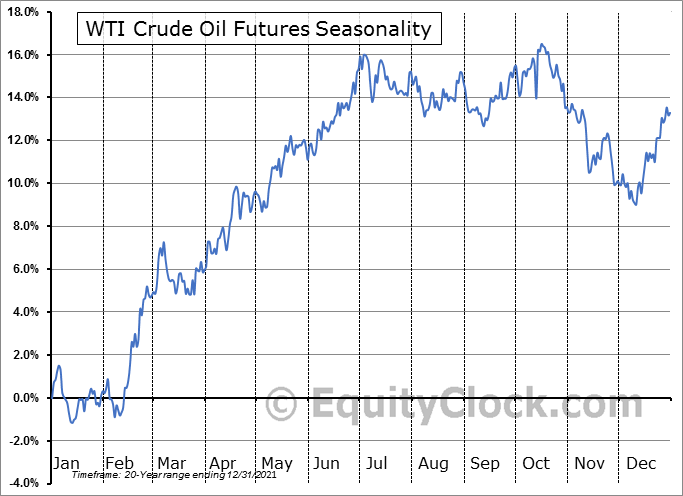
We see that /cl historically ends its last bull thrust for the year in Mid-October.
Yes, that’s a lot of two-sided arguments. And that’s what’s needed to make a market.
