
No, this isn’t going to be some diatribe about Tesla not launching products on time or any other canards. It’s about the stock Tesla (TSLA) and its Fibonacci retracement levels. They seem to have a very intimate relationship.
Here we see the stock over the past few years. There are two Fibonacci retracement pairs on here. Both are anchored to Tesla’s lifetime high, and the lows are anchored, respectively, to the low of June 3, 2019 and the lifetime low near its IPO. As you can see, the prices have an extraordinary respect for the Fibs, alternately acting as support or resistance.
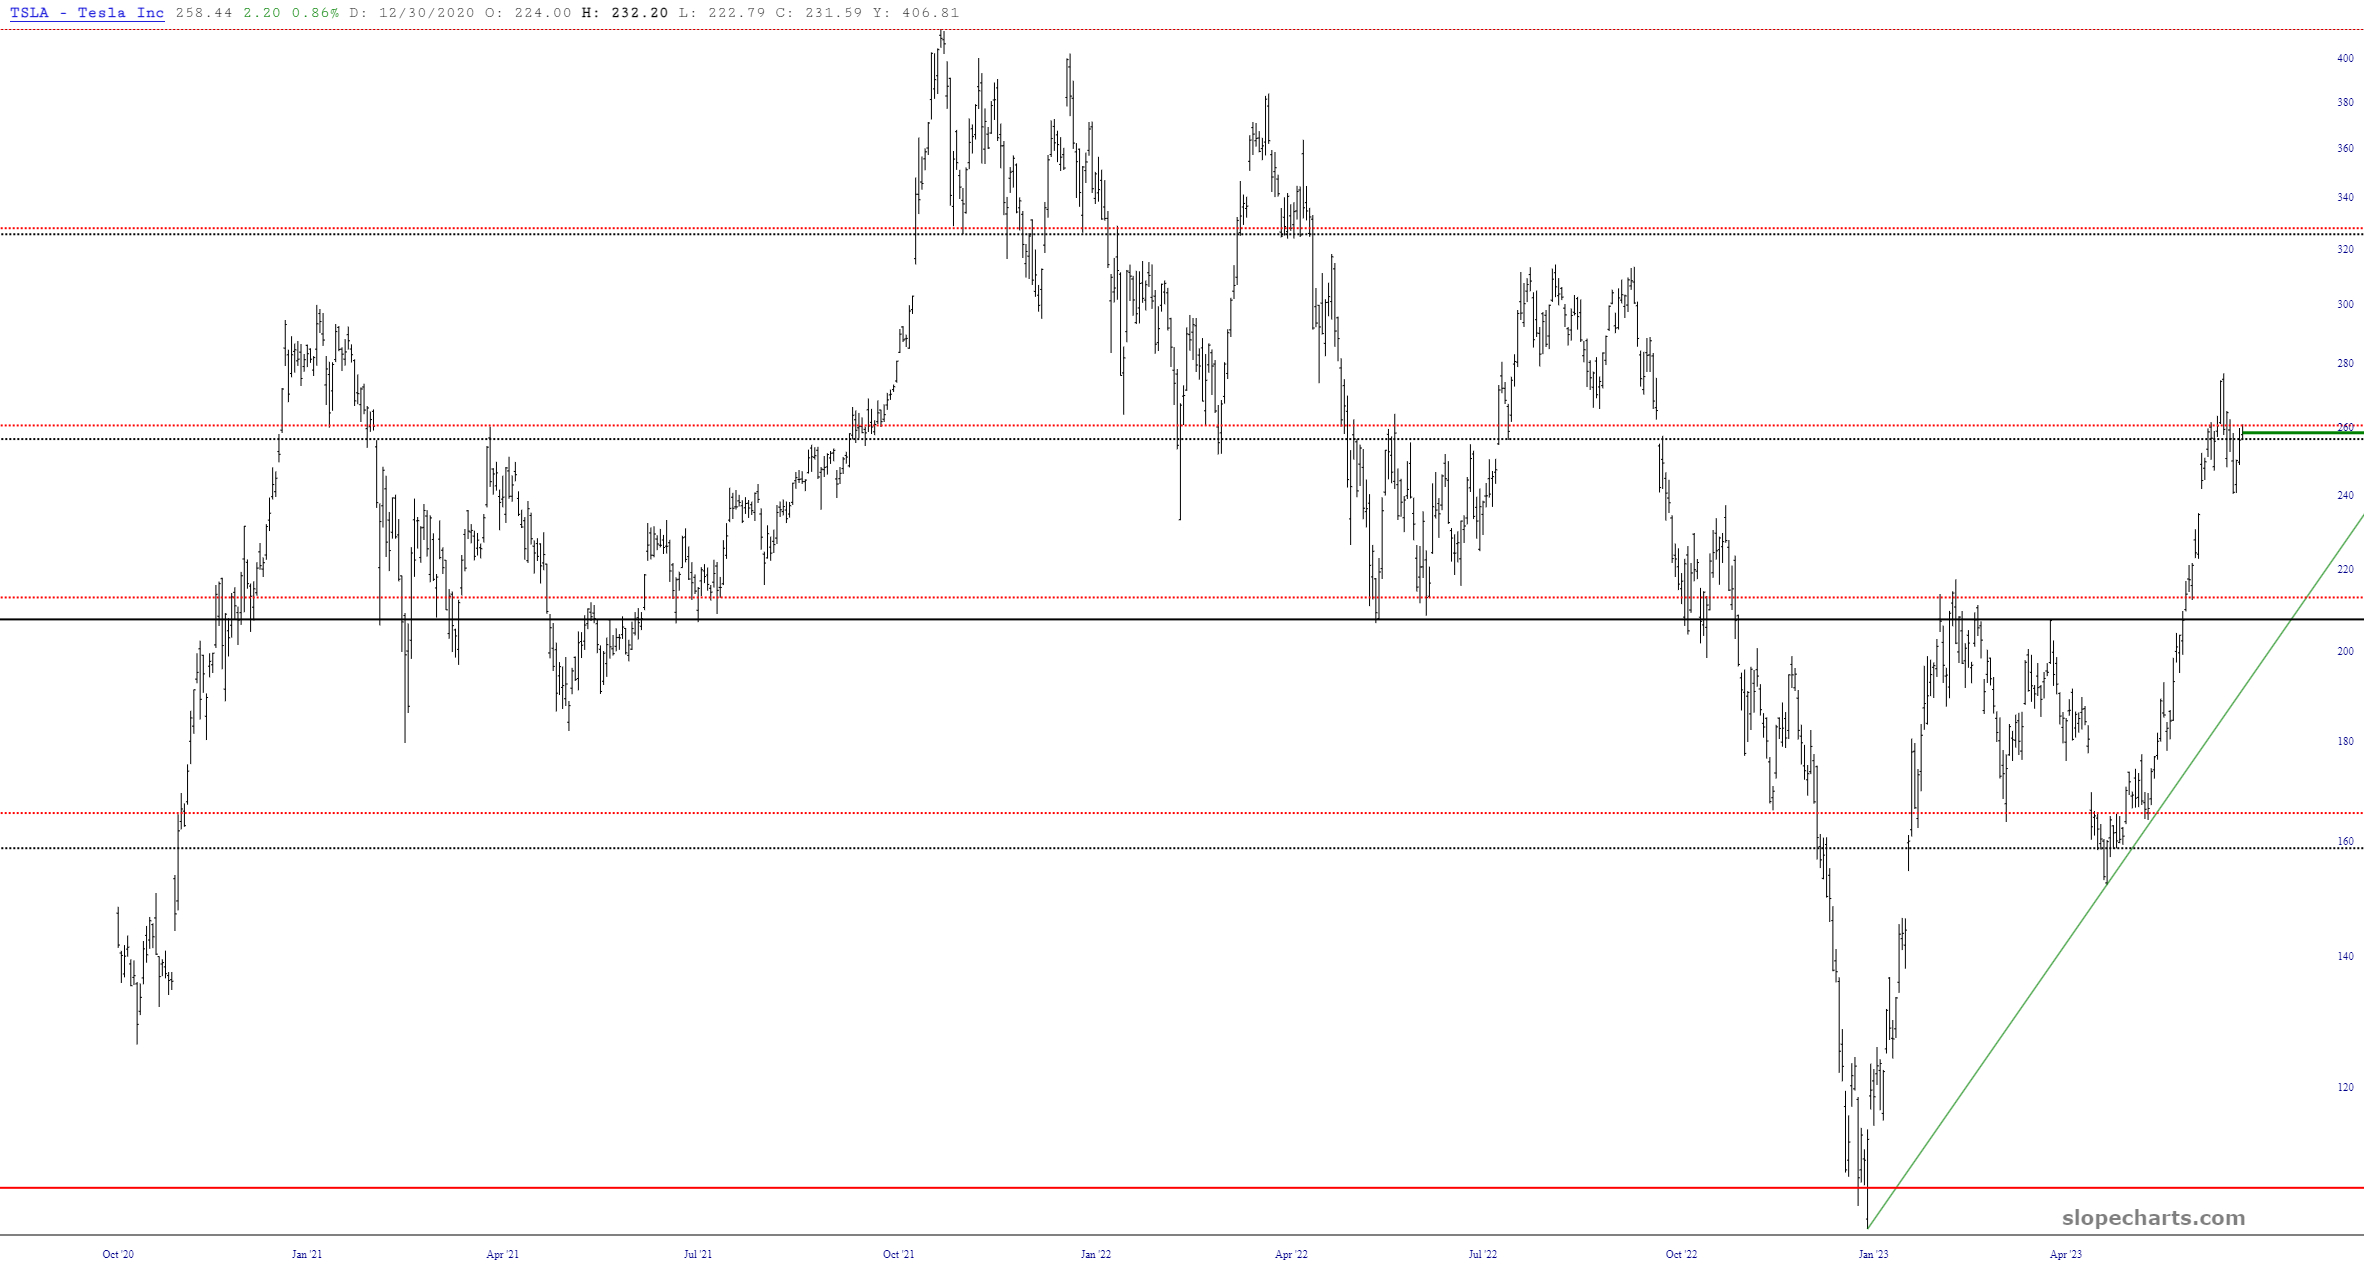
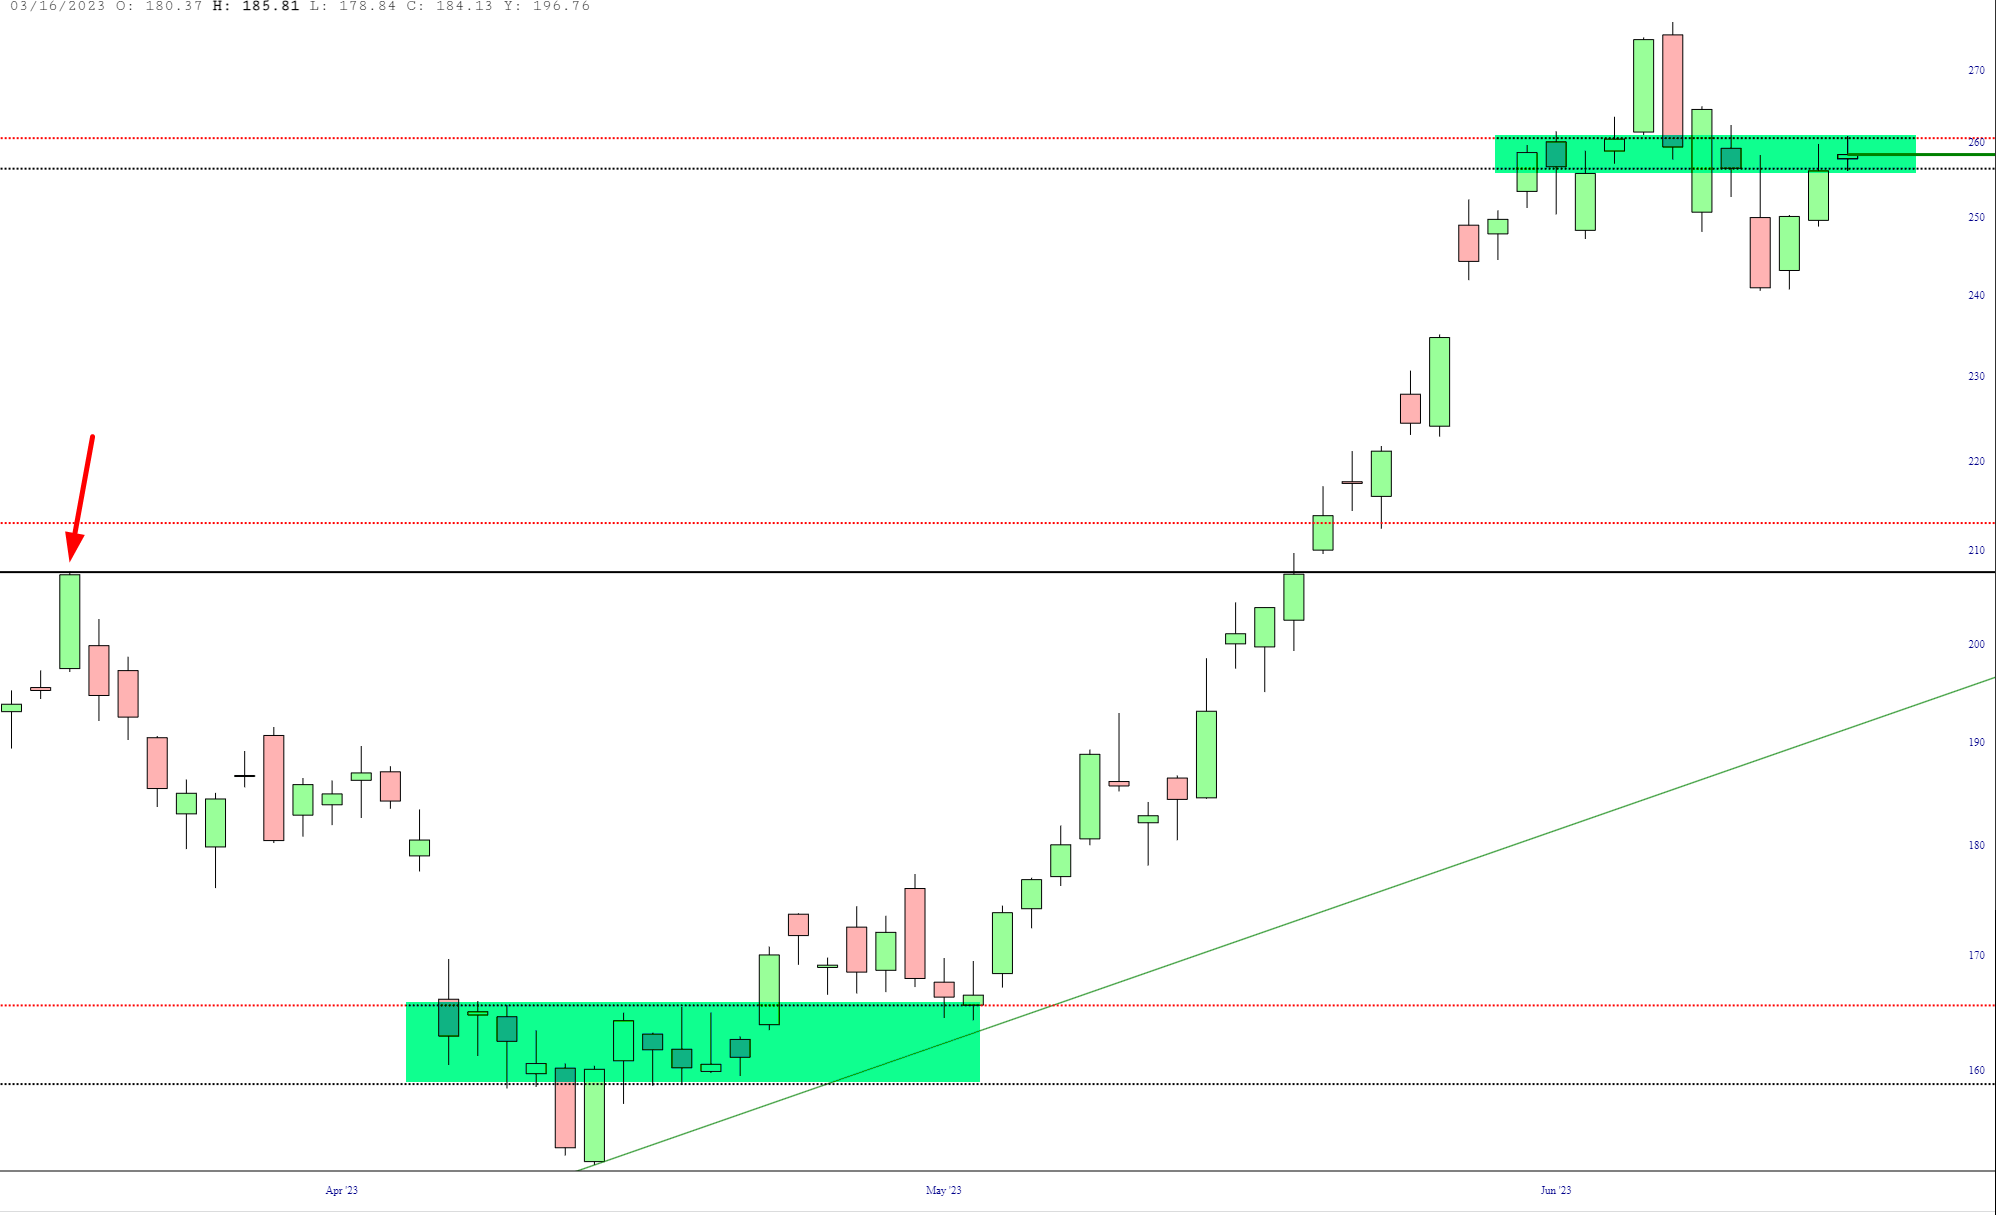
Looking much closer, you can see three “events” taking place. The first, marked with the red arrow, illustrates an immediate repulsion by the Fib, thrusting Tesla’s price lower (yes, there was a time, boys and girls, when prices actually could go down).
The next one was late in 2022 and early in 2023 when Tesla hammered out a bottom. For weeks, prices banged around the two different lines (defined by the separate retracement sets). Once it escaped this magnetic field, it was off to the races. Finally, and most recently, in spite of its attempt to reach escape velocity, TSLA was yanked right back down to those Fib lines and seems positively stuck there, just like it was at the start of the year.
The question, of course, is whether the “break” is going to be to the upside or downside, since it’s likely to be a very pronounced move once it does so. I have no position, but I’m inclined to think it’s going to drop down into the low 200s to test the next pair of Fibs lower before finding strength to make another lunge at breaking above its peak this month.
