
Despite priding myself on organization, my watchlists in SlopeCharts have become anything but and are instead a hot mess of charts not reviewed in months (and in many cases, years). Oh, dear. Goes to show how leaving for tomorrow what can be done today, has a way of messing things up.
Taking watchlist cleanup on as challenge, I began the process thinking there would be plenty of purging, but so far, that’s not been the case. I started with just the “short” watchlists, four of them totaling 178 issues, and haven’t nearly gotten through those. Another factor is that most of the charts I’ve reviewed so far still deserve the “short” classification.
Starting with good ol’ almighty SPY, here are a few charts plucked from the still-messy short watchlists. [Note for all charts: green and red horizontals represent the top and bottom of the Ichimoku Cloud.]
SPY’s yearly and quarterly charts are green. This is the weekly, with the ADX indicator.
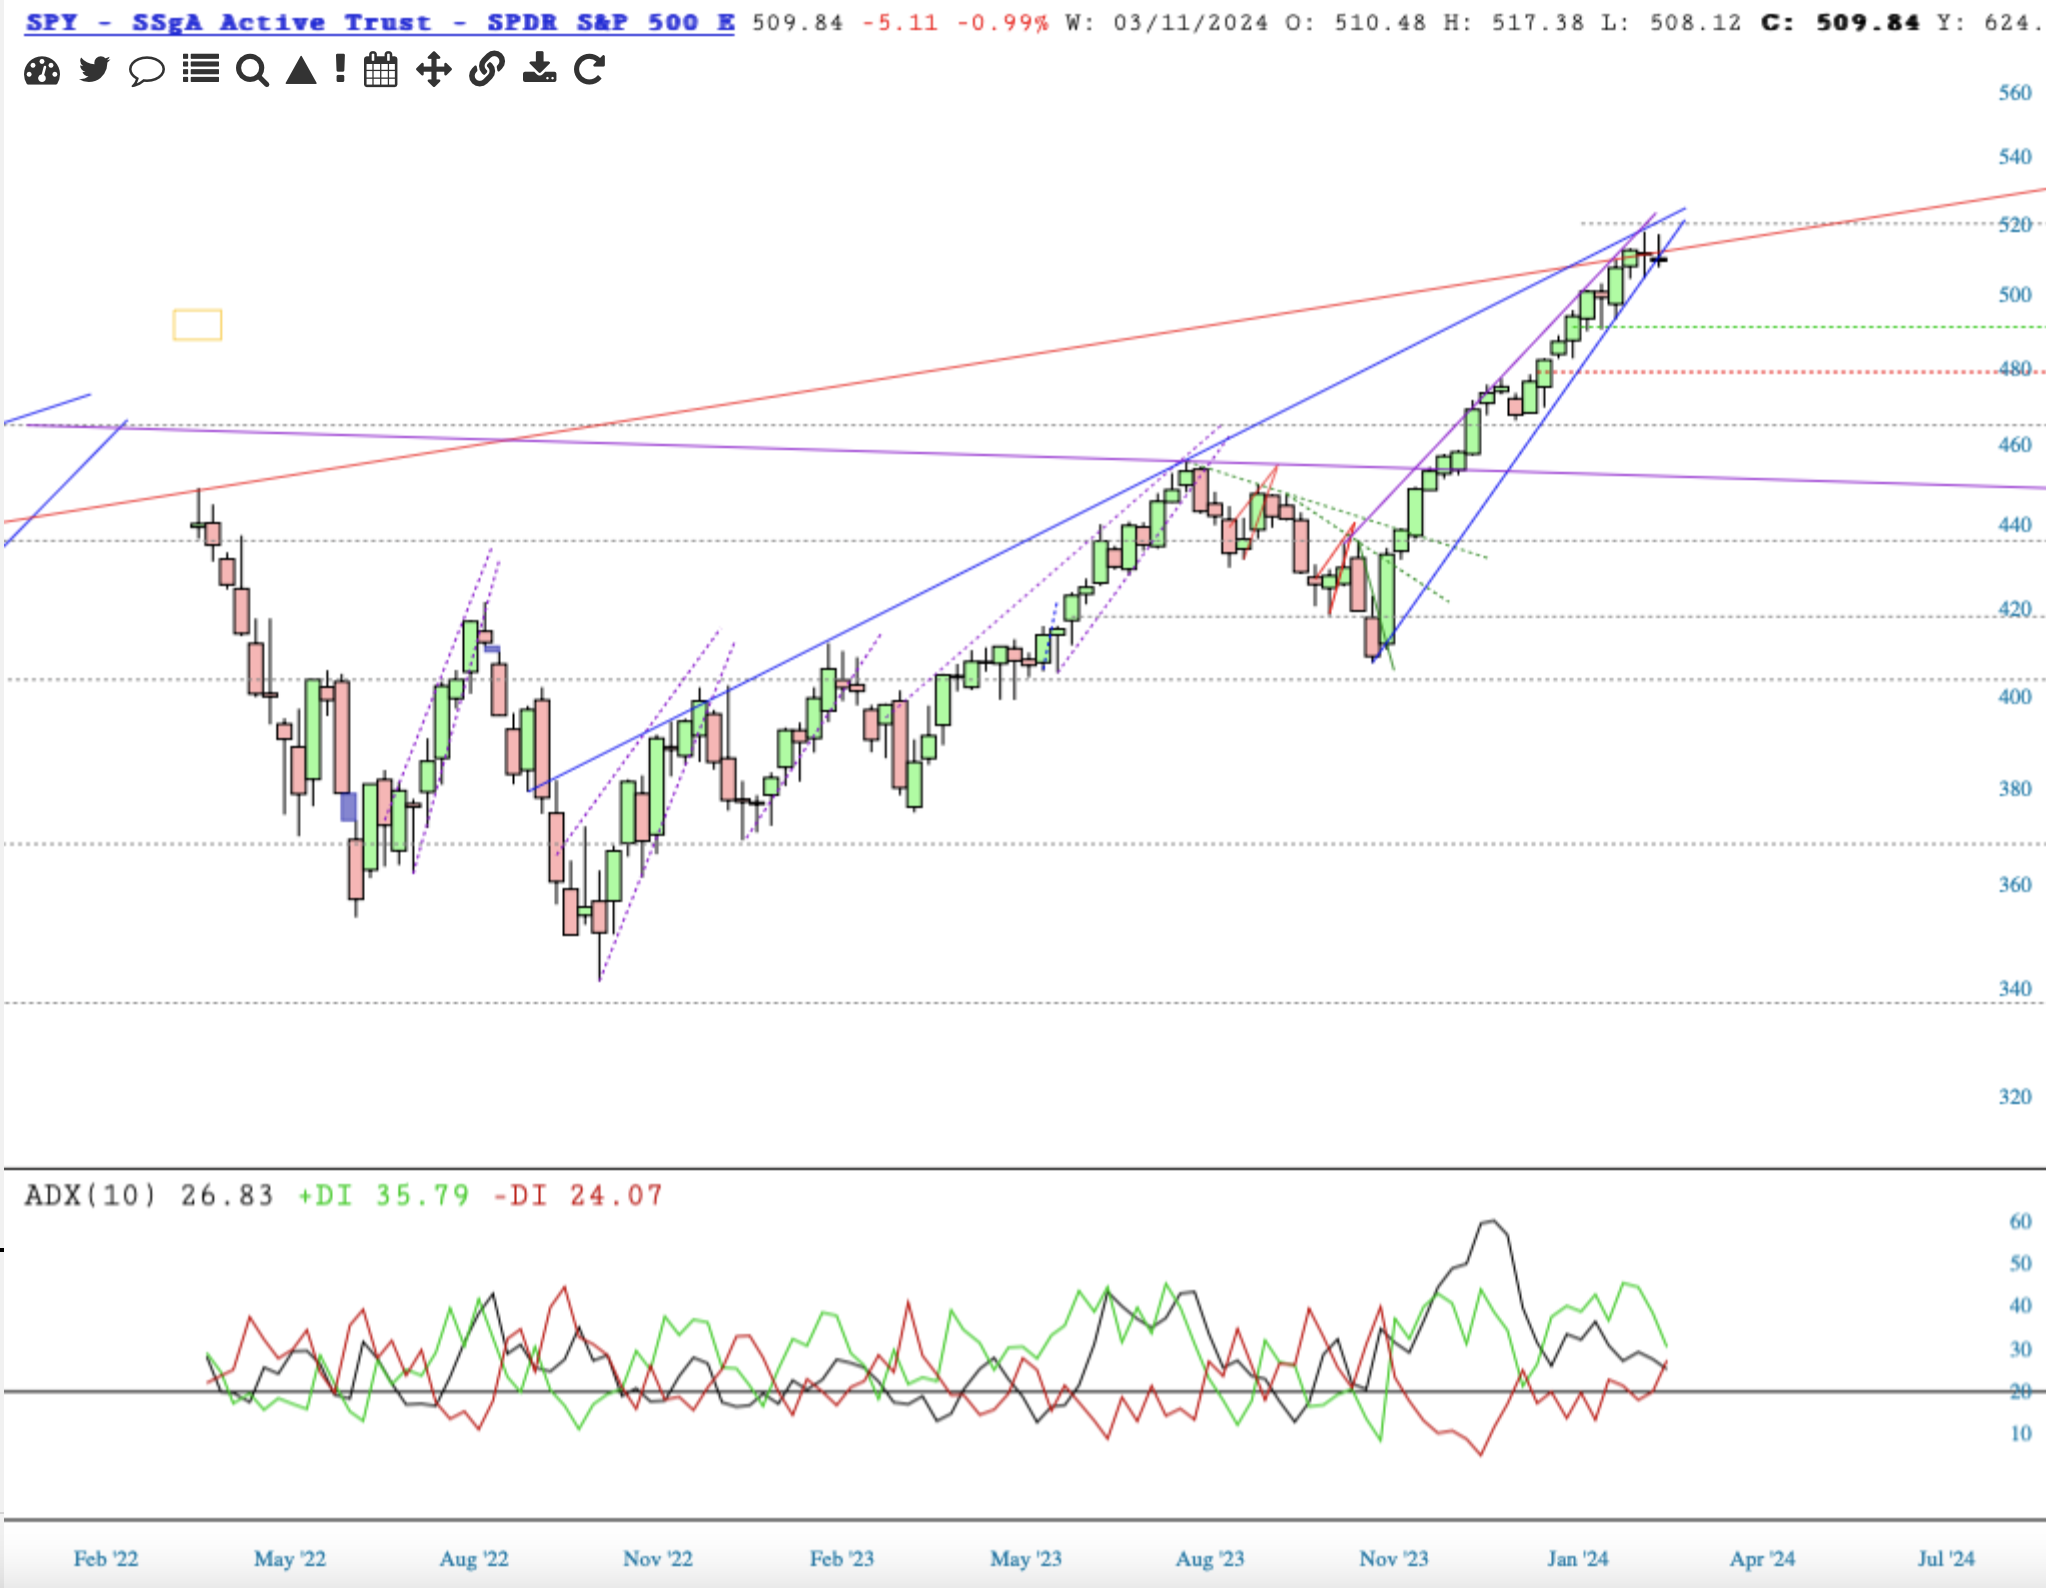
The red and green lines of ADX give price movement, down and up. The black line indicates strength. Beginning in January, note the divergent rise in price, with the fall of the black line, indicating loss of strength in the price rise this year.
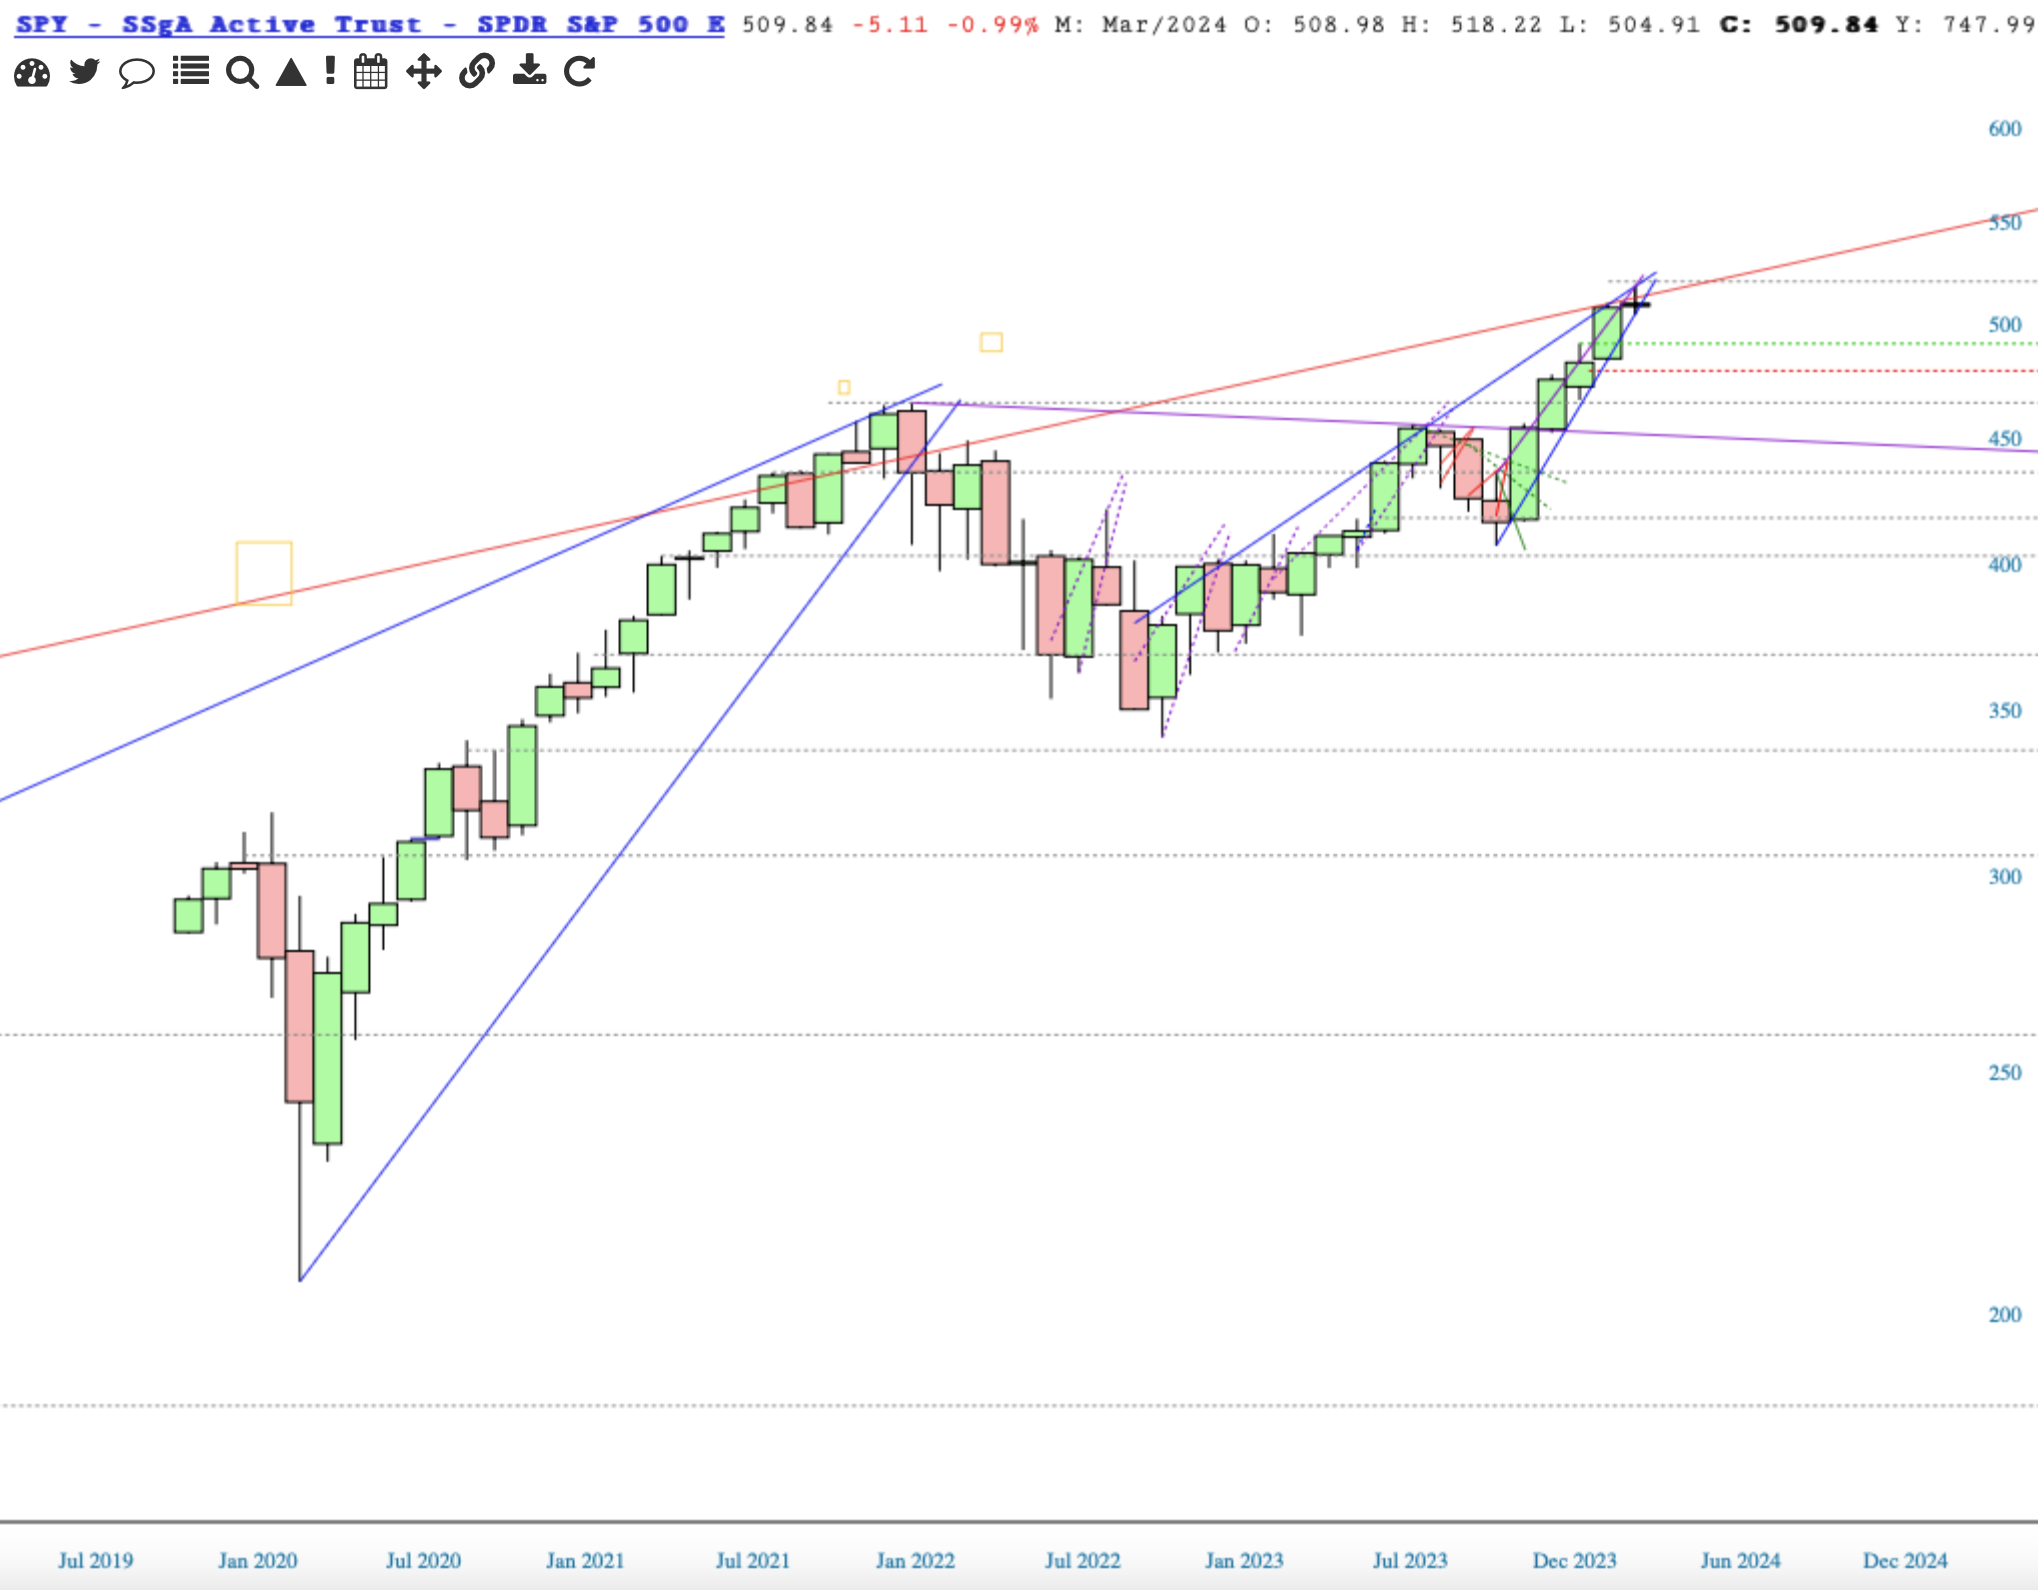
SPY’s monthly chart shows price just under the wire, and at all time highs. SPY can fall a fair distance further without upsetting a bull case, I’d say to the gray horizontal of the outside high from Jan 2022. Losing support of the purple trend line is a different matter.
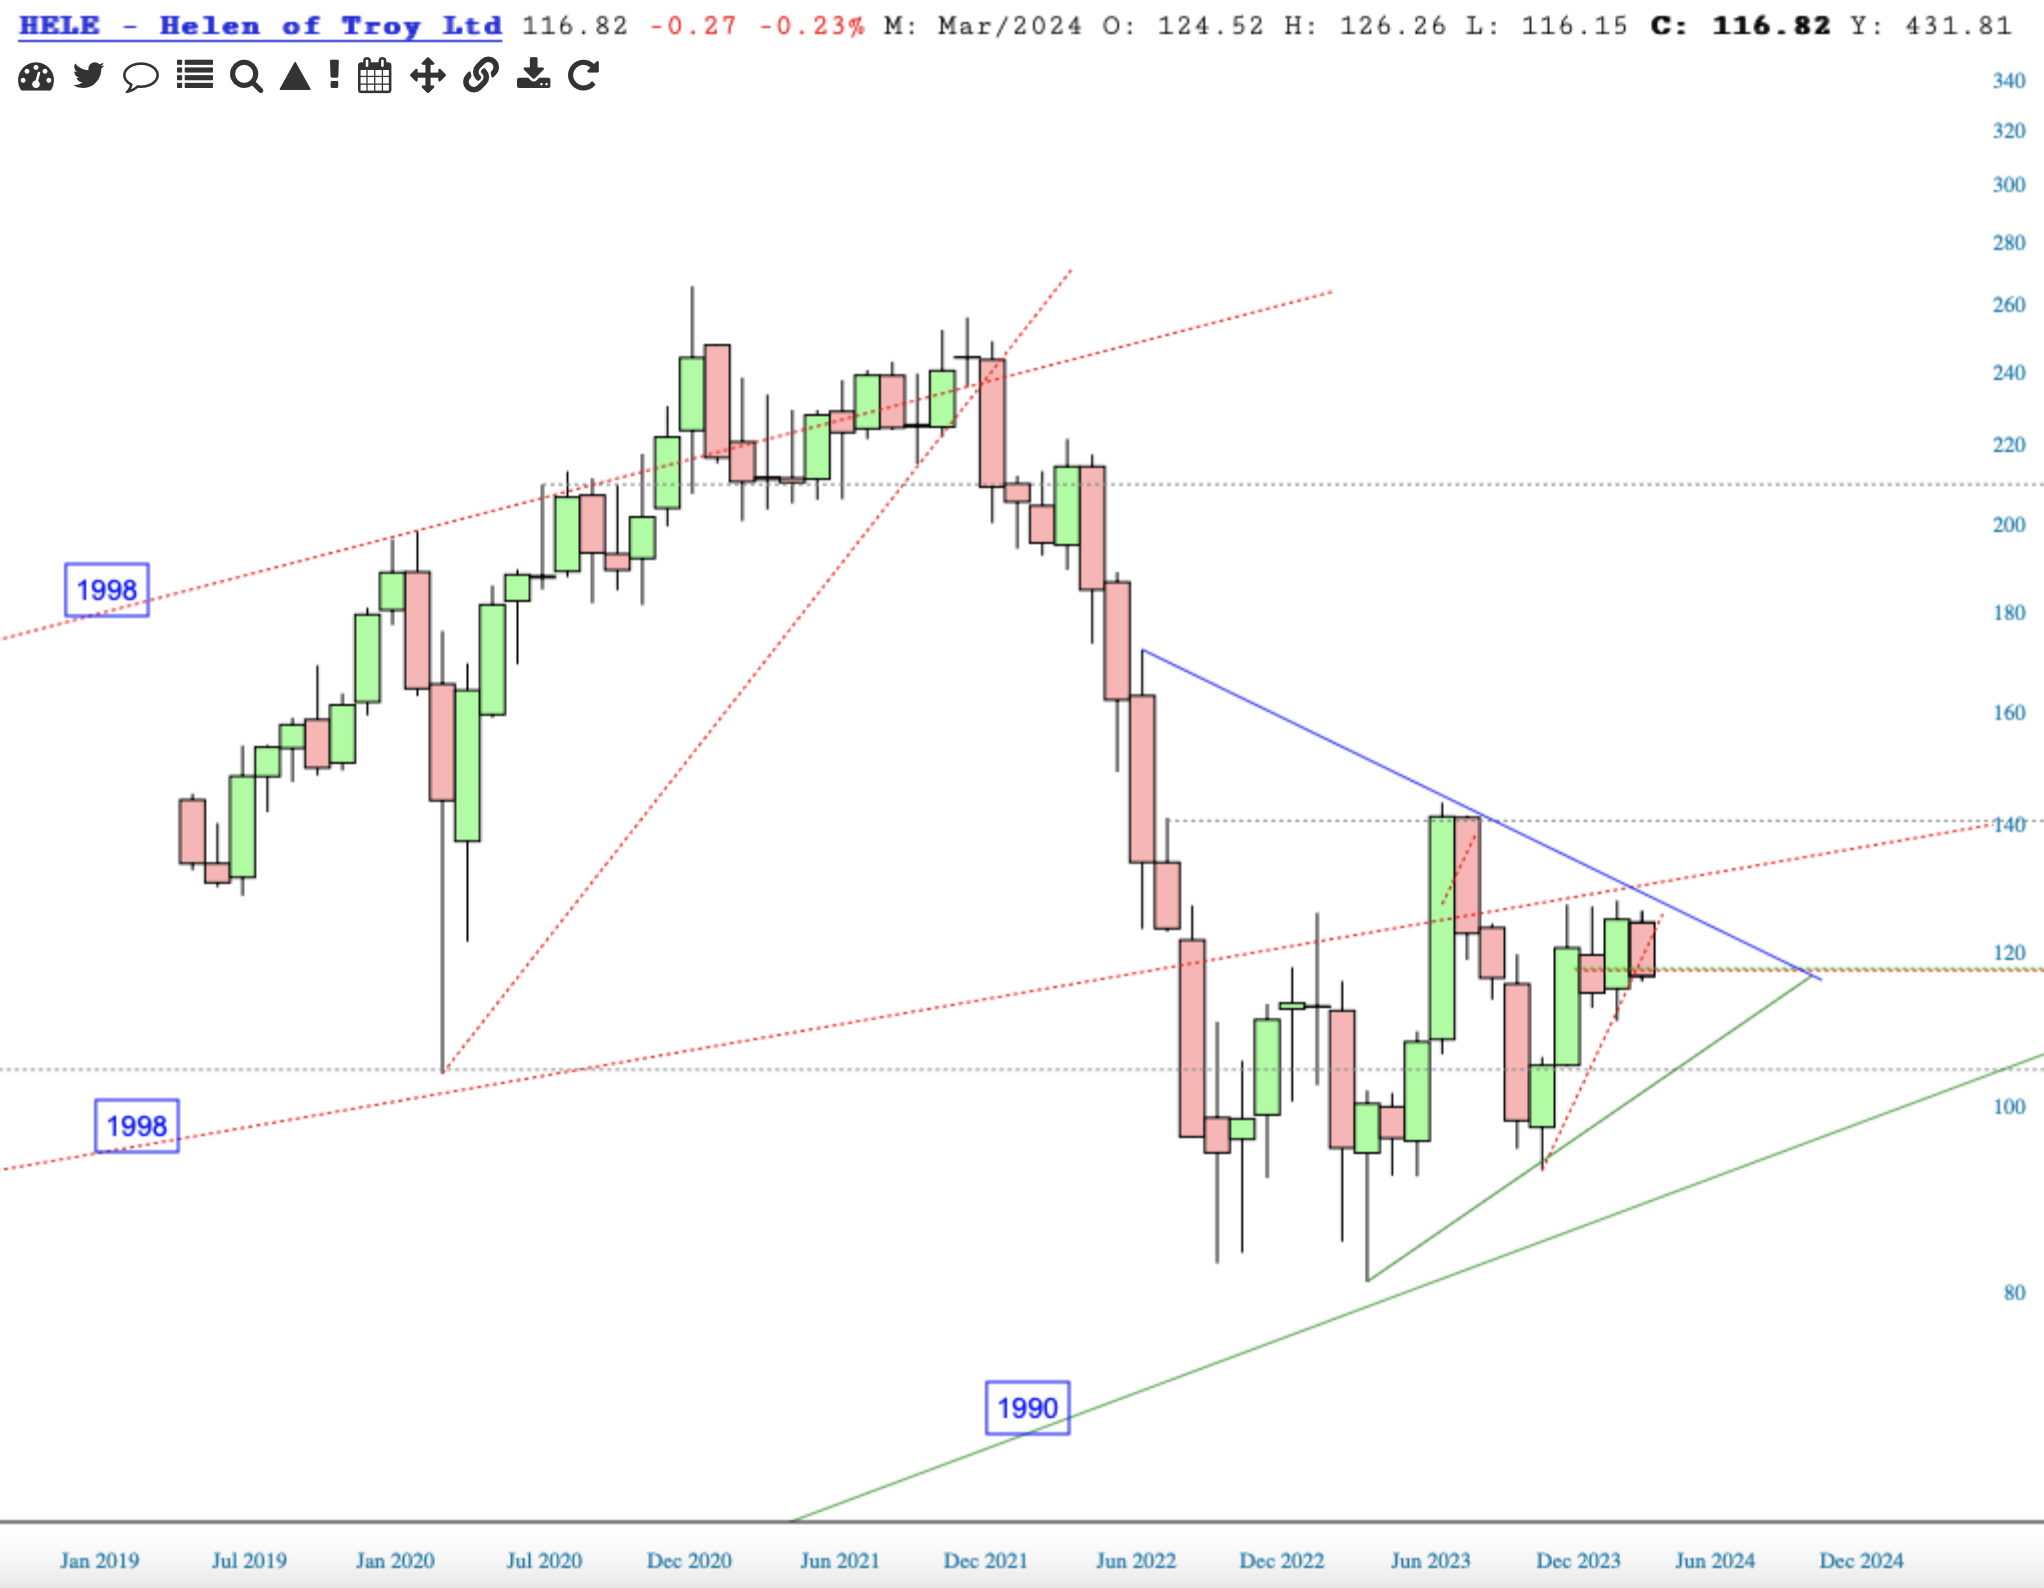
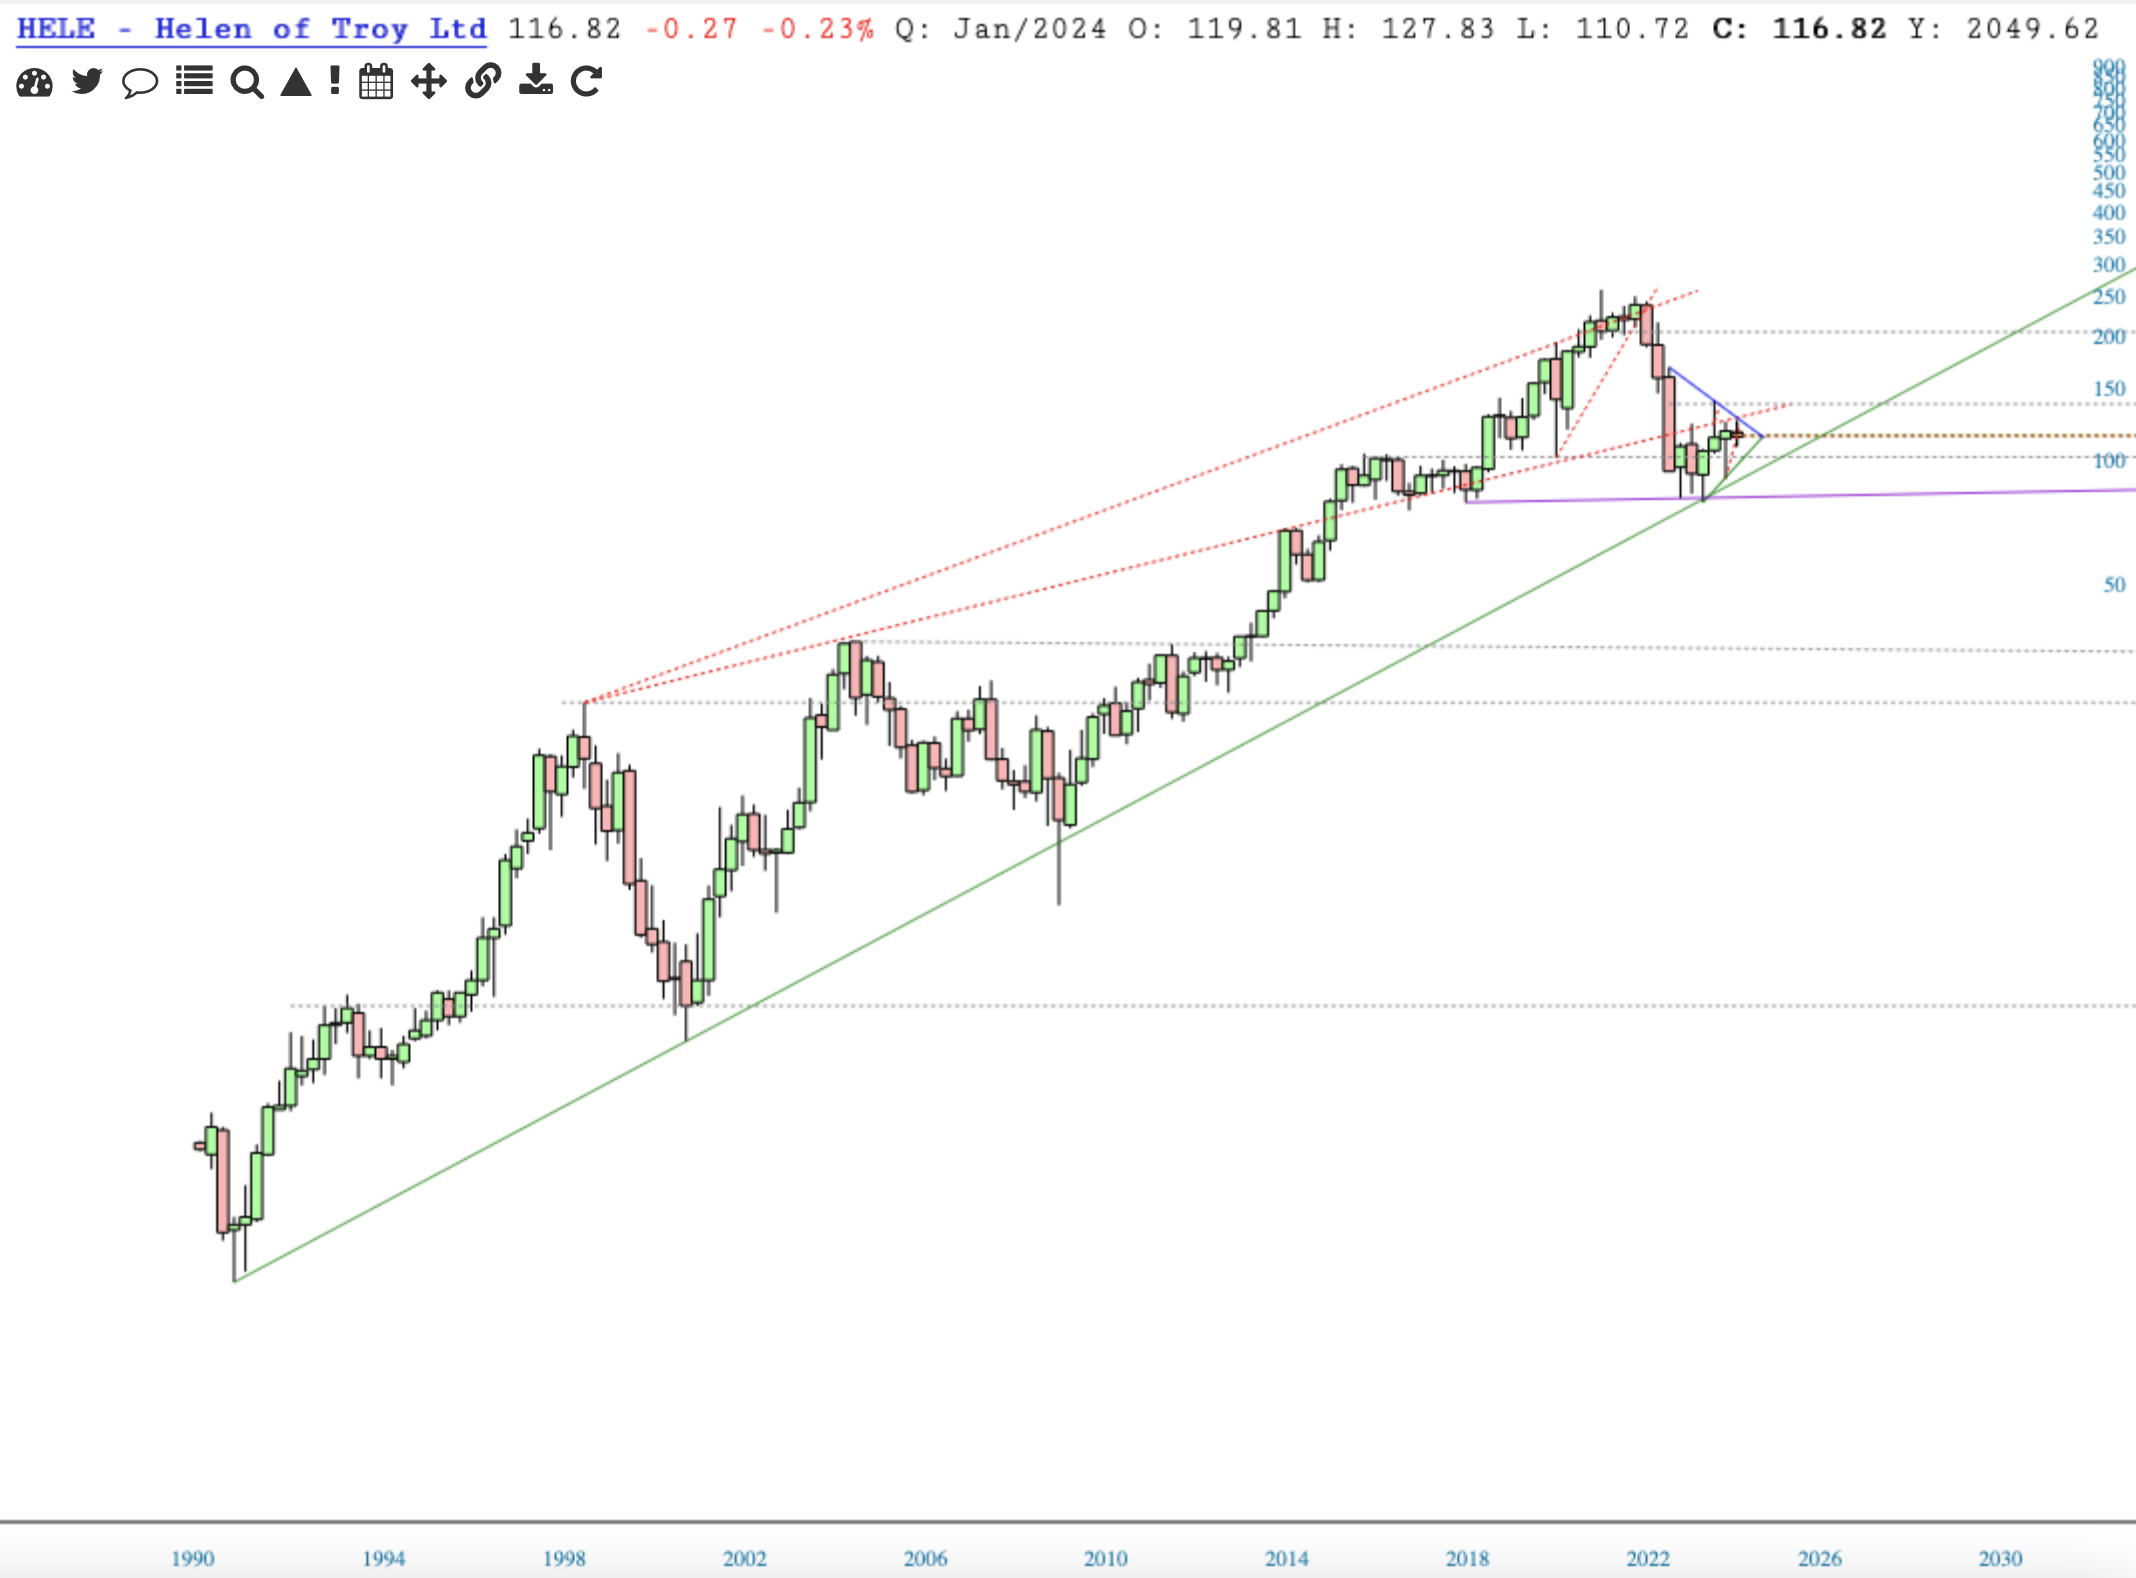
The monthly chart of HELE shows us what we need to know. The big bear case requires losing support of the upper green trend line. If it loses that support, it may well have the momentum to lose the long-term support from 1990.
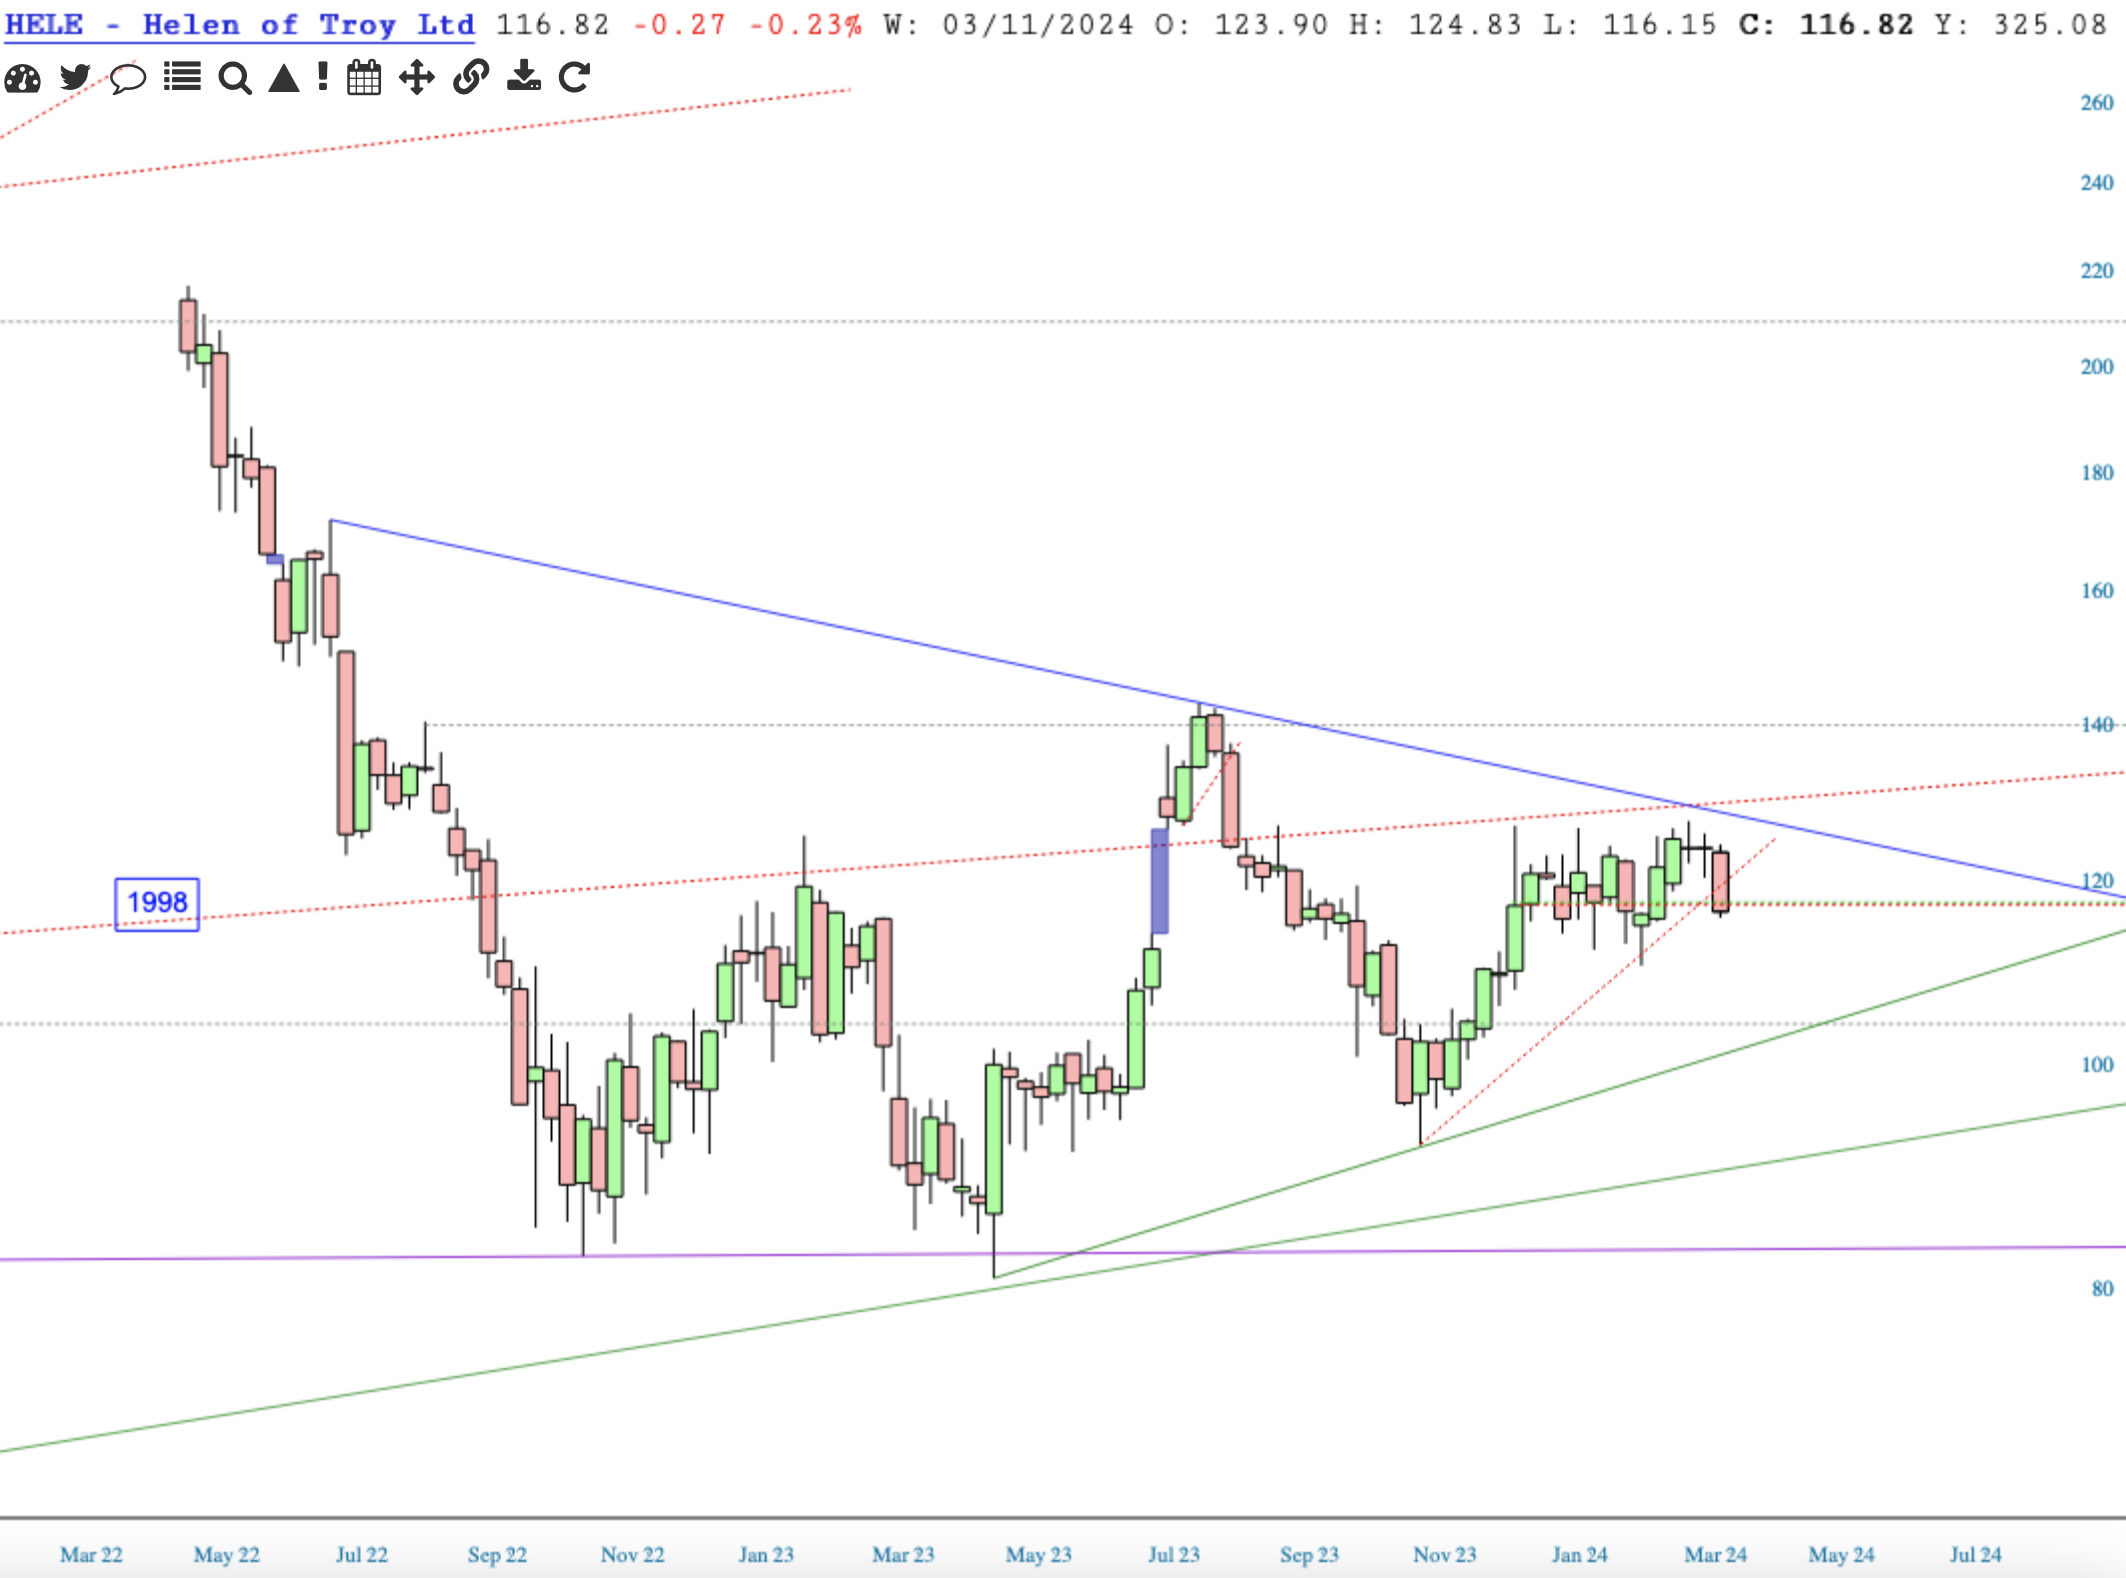
HELE’s short term weekly chart shows an uber-thin Ichimoku Cloud in the middle of the triangle, under which price has just fallen.
Not a particularly good look for HELE on the quarterly chart.
Looking at the daily chart of HIBB, I don’t know how the doji will play out, but it’s a doozie of a candle right in the teeth of resistance. Gaps are marked with fuchsia horizontals.
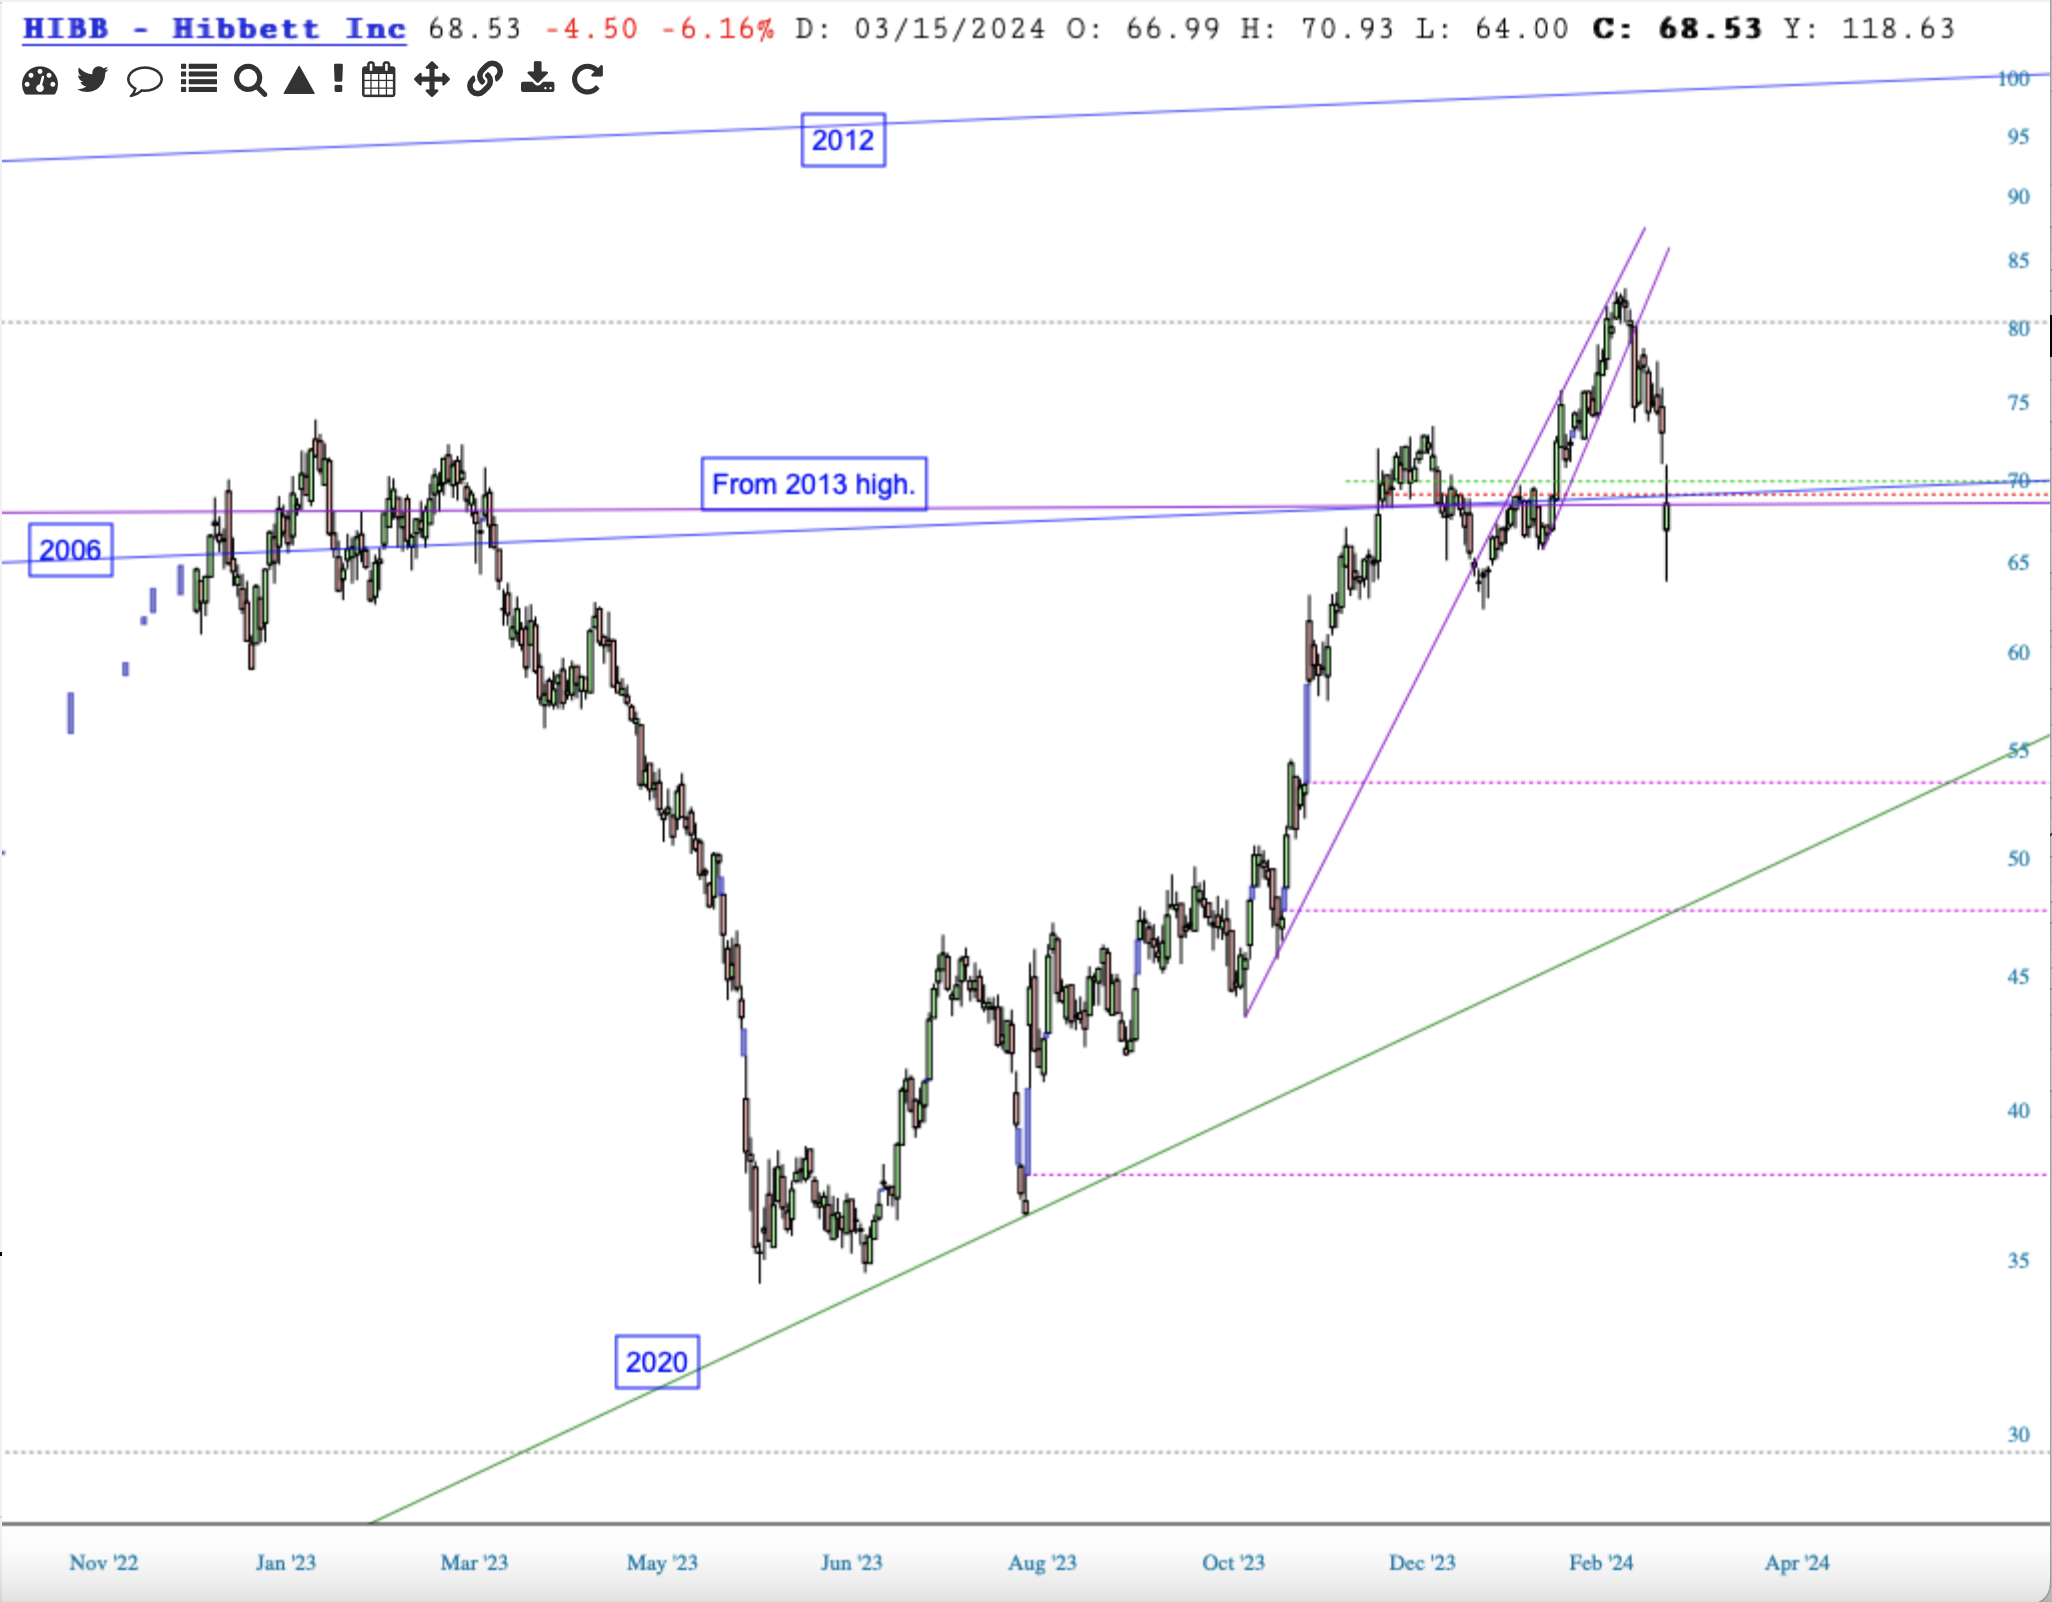
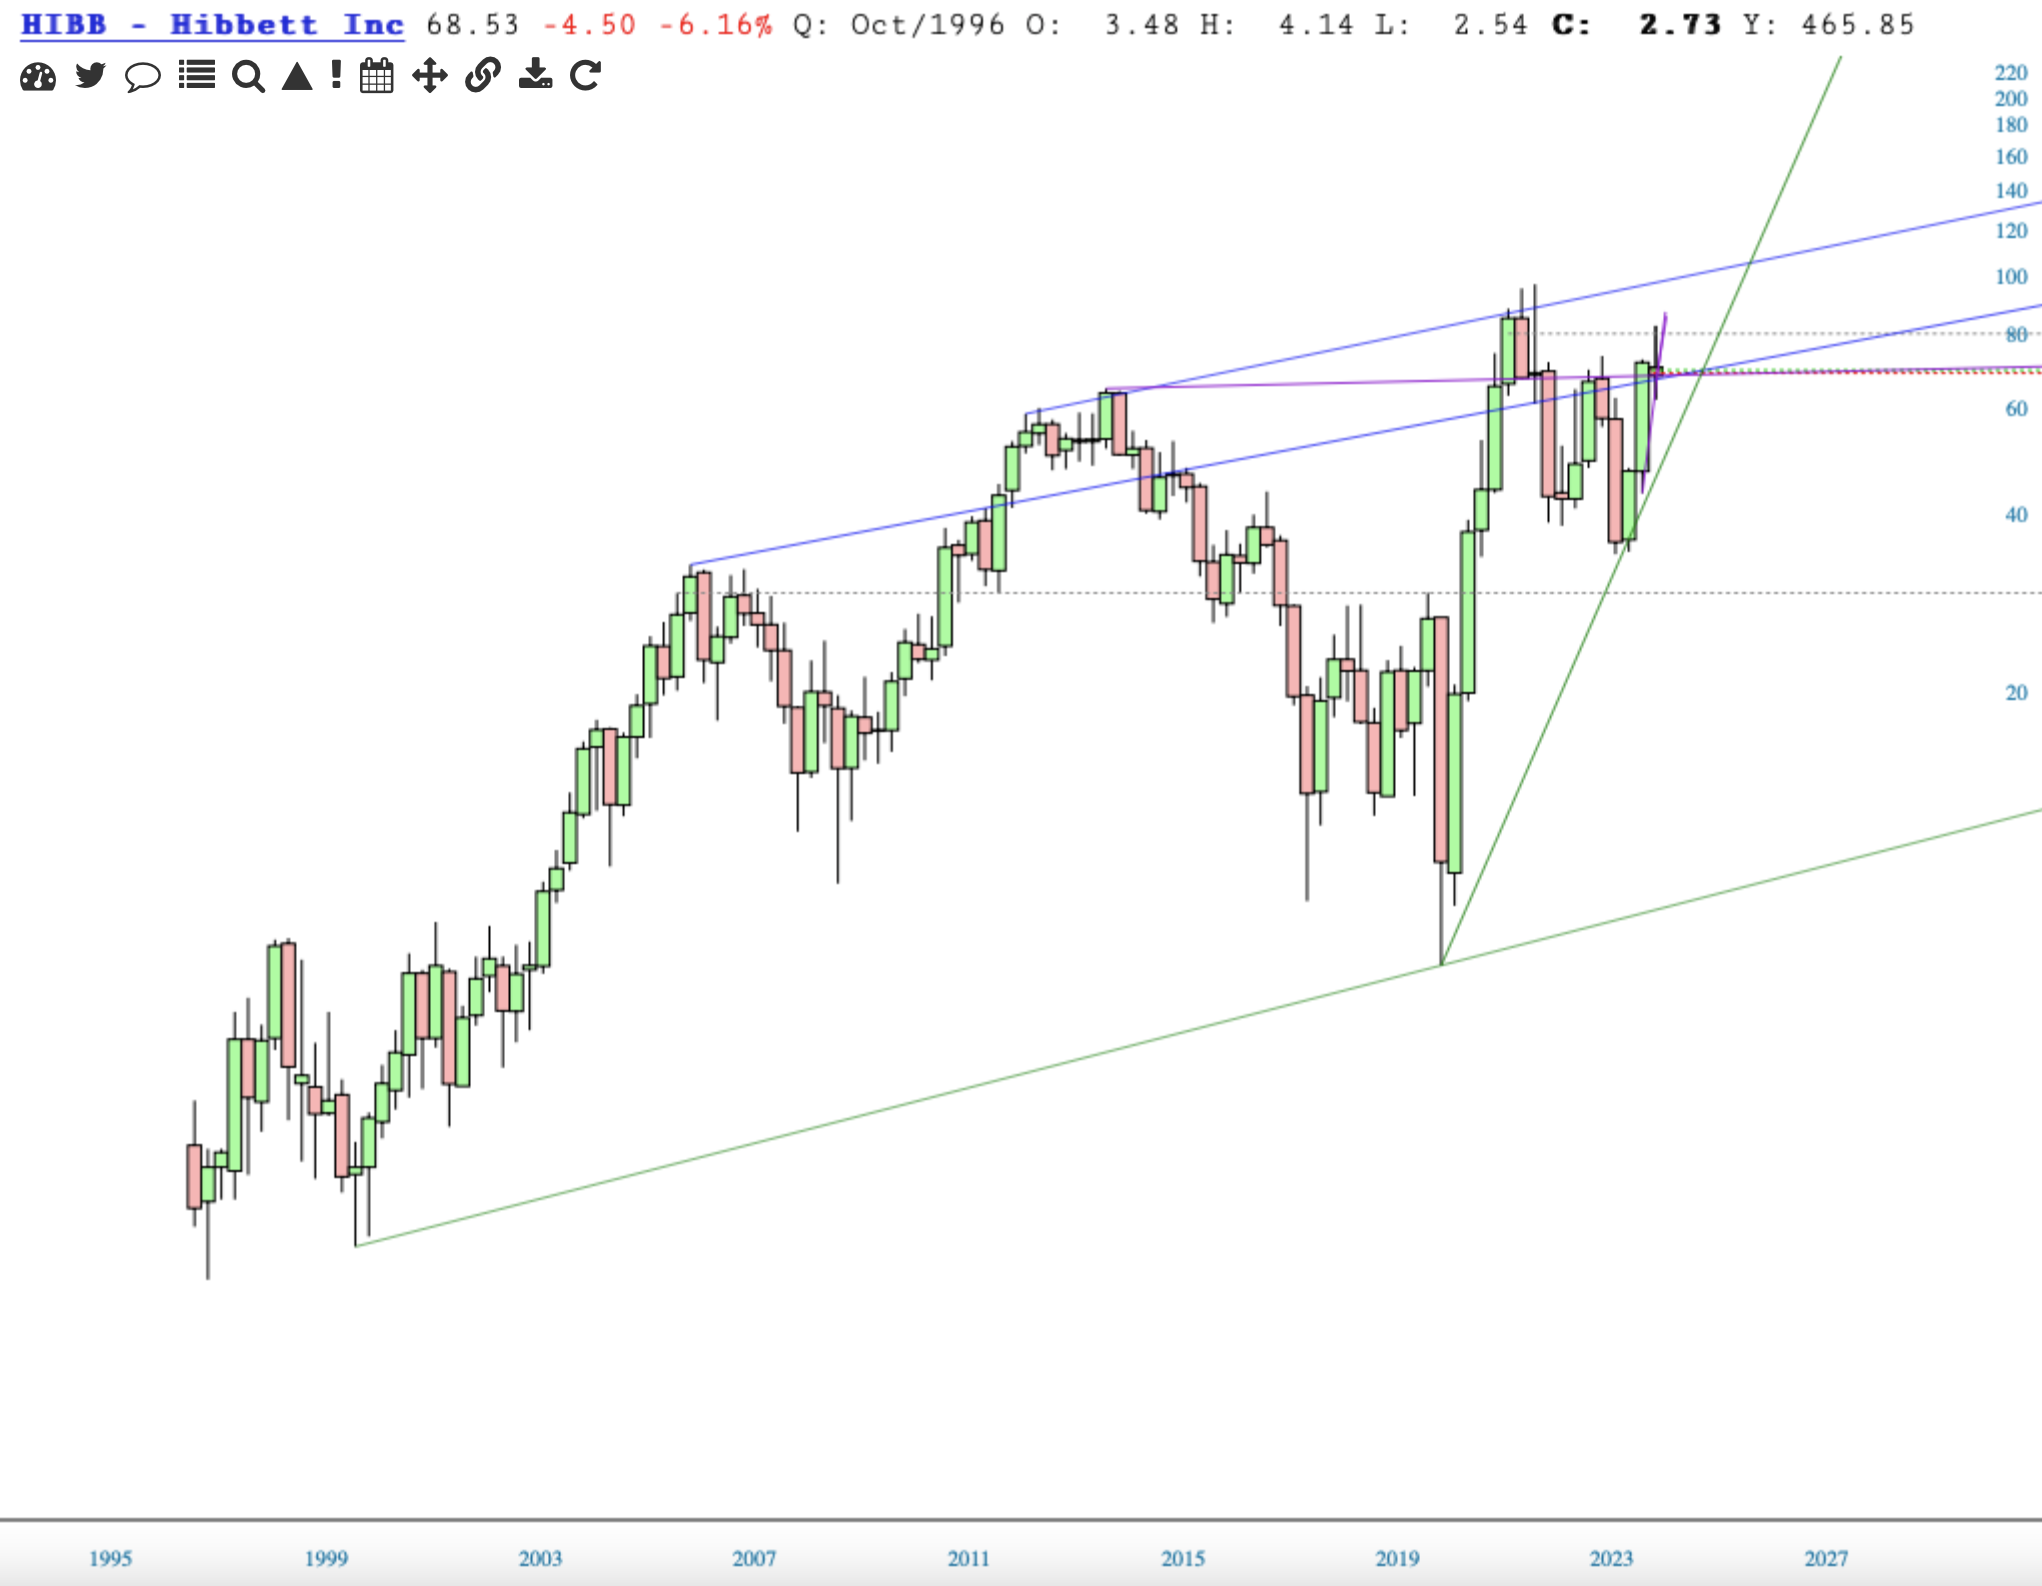
Still plenty of time for HIBB to catch a bid, and it may, but the quarterly chart, too, sports a doji.
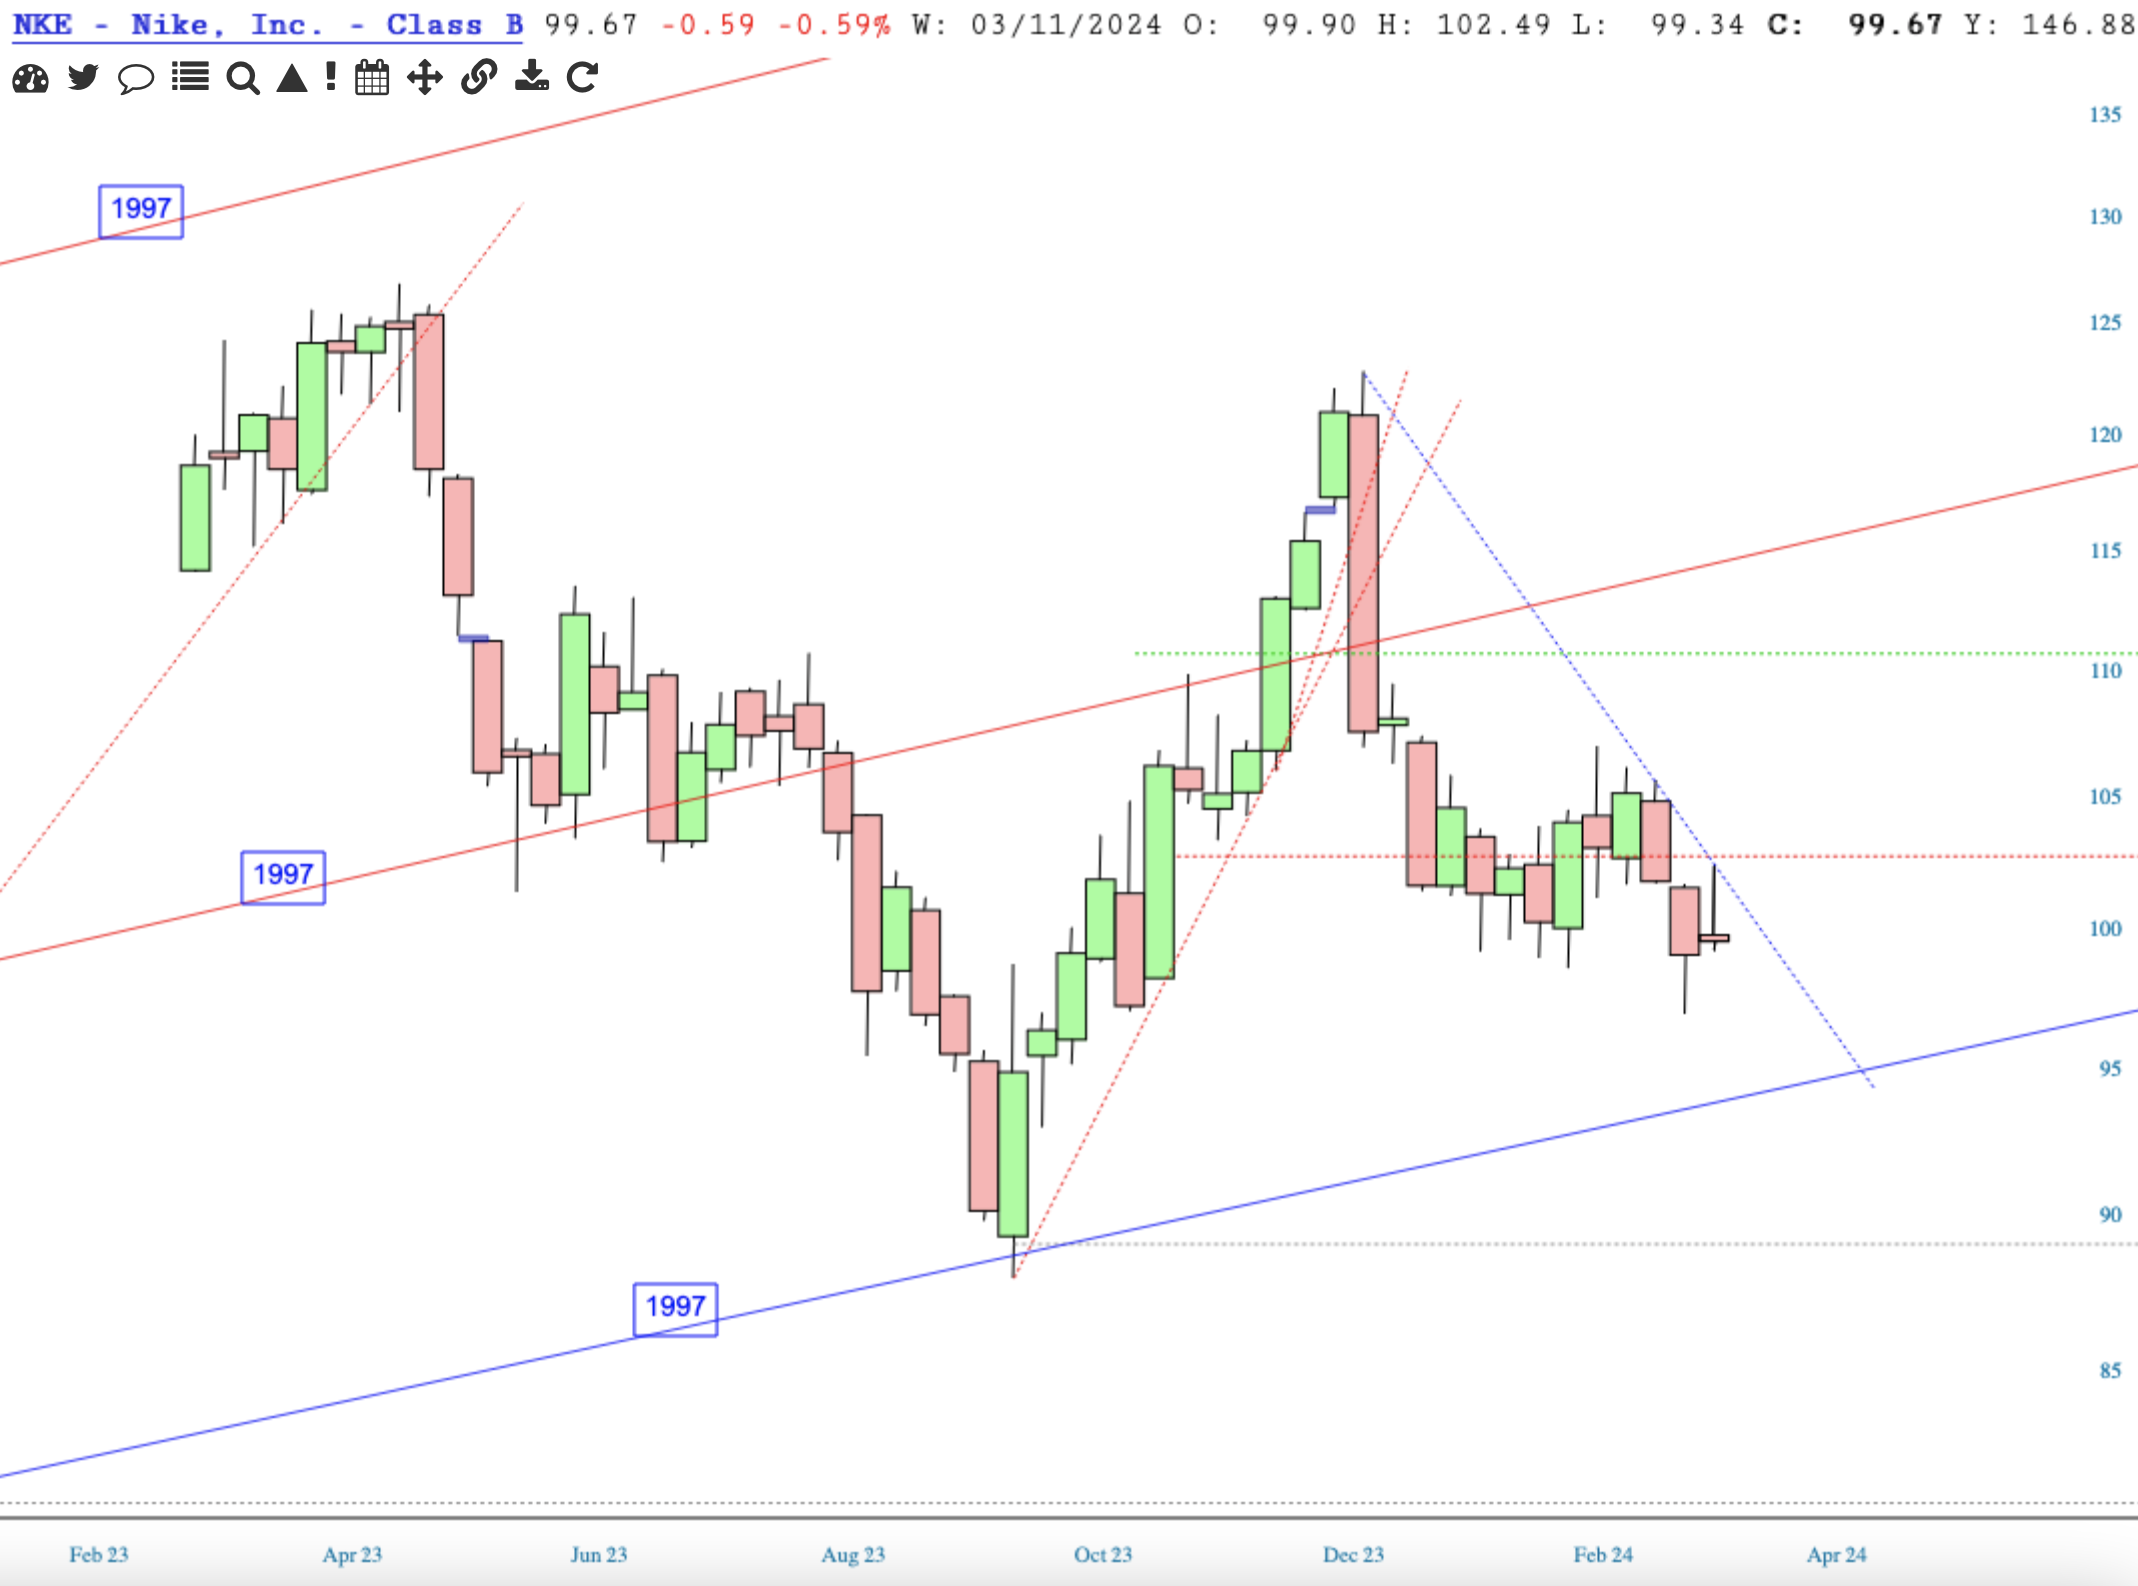
NKE lost its bid for higher highs in Nov 2021. [Crowded chart but leaving the red lines to show what has been lost.] Price now counting on the next – blue – level. I’d expect a big slip ’n slide if it loses this support, possibly down to the bottom blue trend line.
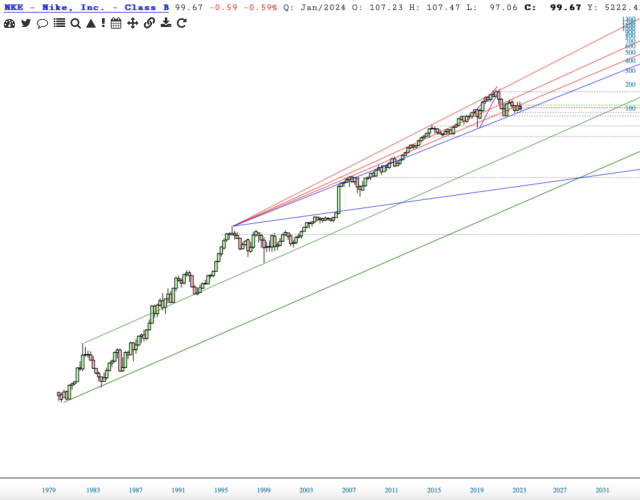
Taking a closer look, the NKE’s weekly chart is struggling.
Fessing up here, I’ve got 39 cluttered watchlists, lying in wait of a cleanse.
Being a good Tara, I’ll worry about it tomorrow.
