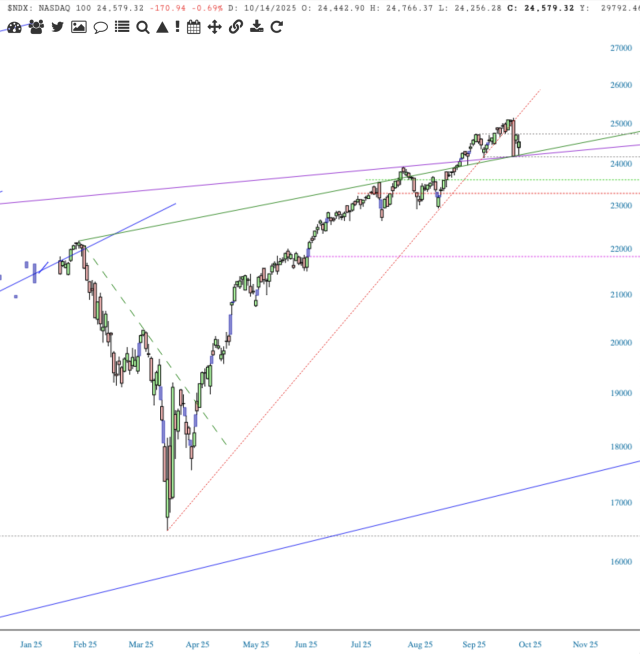
$NDX is the zippity-do-da, hubba-bubba, yippee-yi-yo-kayah of companies. It’s the monster mash.
A muy perfecto trendline (dotted red), attending the monstrous run-up from 7Apr25, cuts the top off of $NDX. And we dropped last Friday.
Slope initially began as a blog, so this is where most of the website’s content resides. Here we have tens of thousands of posts dating back over a decade. These are listed in reverse chronological order. Click on any category icon below to see posts tagged with that particular subject, or click on a word in the category cloud on the right side of the screen for more specific choices.
$NDX is the zippity-do-da, hubba-bubba, yippee-yi-yo-kayah of companies. It’s the monster mash.
A muy perfecto trendline (dotted red), attending the monstrous run-up from 7Apr25, cuts the top off of $NDX. And we dropped last Friday.
Years ago, for a job, I made a recipe card for Black Gold. It was distributed to the public and was a featured handout when we held elementary school Compost workshops – where we made soil.
Working with the kids was fun. We got our hands dirty planting flowers, planting trees, pulling weeds, making black gold. Through a grant we made to elementary schools [$5k total; 5 schools], we built 3-bin composters made of timbers, posts and wire. Parents and students built them, and there were community contributions for some of the materials. (Big bang for buck.)
Black Gold. The dark, almost sweet-smelling, rich loamy soil that one makes from carbon and nitrogen sources. When I built a composter in my yard, I’d take a 50 gallon metal drum in the truck, drive down the road a few miles to the chicken houses, where I’d backup under the shoot and fill the drum with fresh chicken manure, a premium let’s-go material.
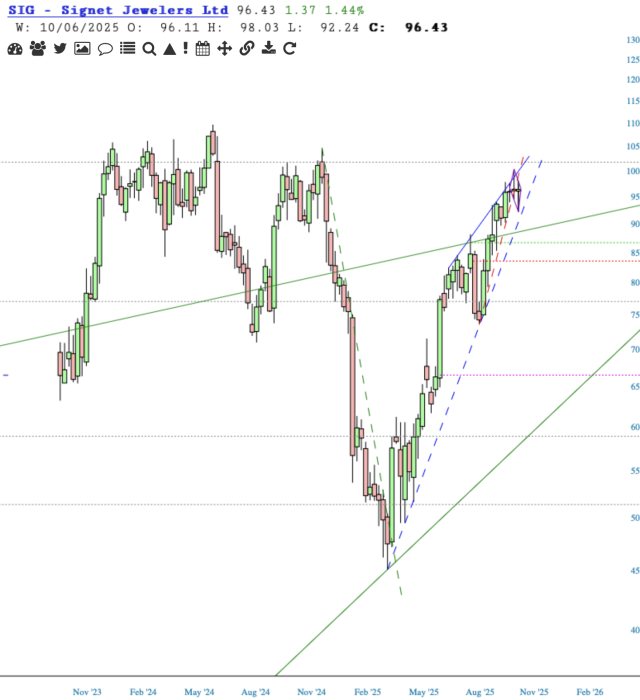
Signet Jewelers’s [SIG] V-recovery was most impressive, altho it missed the high-water mark. On this weekly chart, price is now in a bearish rising wedge. Falling down out of the wedge is the shorting trigger. Negating this shorting op is if price breaches resistance of the dashed red and solid blue line.
After I wrote the other day about Walmart’s weak chart, it shot higher, up about 14% for the year. Dummy me hadn’t even checked their earnings date when I wrote the piece.
After Walmart’s earnings report this morning, Investopedia wrote that “all 12 of the analysts tracked by Visible Alpha with recent assessments recommend buying shares.” If they liked shares at $102, I imagine they like them even better now around 98.
Walmart’s earnings didn’t meet analyst earnings projections of $0.73, and instead were $0.68. Gee, a $0.05 difference and the stock price slides. (Recall at their prior earnings report in February that WMT said to expect lower earnings.)
(more…)Walmart. Sam Walton opened the first store in 1962 in Bentonville, Arkansas, and the company has done nothing but grow since. Despite that success, Walmart’s stock does not always go up.
With the uncertainty of the effect of tariffs placed on imports from China, in their earnings report of February 20, 2025 Walmart acknowledged that earnings for 2025 would be below expectations.
On 3Mar25 I did a post on Walmart reflecting that its chart looked vulnerable to downside risk. As it turned out, it was a timely post, price dropping the next trading day and ending a month later at the year’s low. In the daily chart below, the purple highlight on the left marks the date of that post. Note where the Ichimoku Cloud is (green & red dotted horizontals).
(more…)