
Screening is coming to Slope! I don’t normally do this, but I’d like to open up a page that’s still in development to everyone so I can get some testing and feedback. The page itself is located here, and I’d like to tell you a bit about it. The first thing is that this product is absolutely not complete, and there are some important features that will be part of the finished page that aren’t here yet. Having said that, let’s begin with the sliders……….
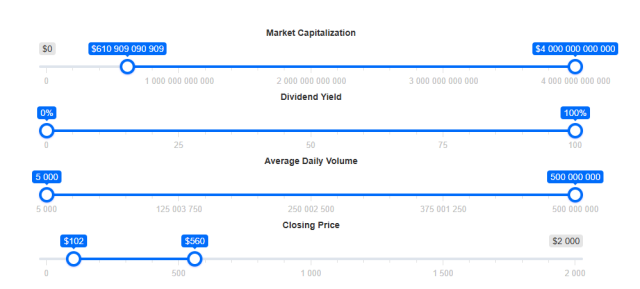
As I’m sure you can guess, these sliders make it very simple to define the parameters of a screen. They are vastly more intuitive than some of the ghastly interfaces I’ve seen on other screeners, since you can just drag either one left or right to tweak the parameters. What’s really cool is that, shortly after you make any adjustment, the number in the Display Results button will update, allowing you to see in (almost) real time how many stocks qualify.
As for the row of buttons, Save Settings presently is non-functional (as is its companion dropdown of saved screens). Clicking Display Results will do just that, provided you have established enough parameters to get a list of fewer than 500 stocks.

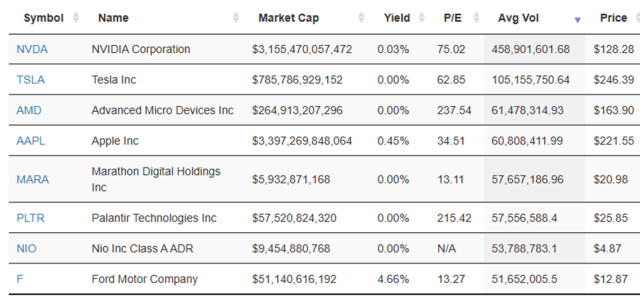
The information displayed is so voluminous, I’ll break it into two chunks. The left side shows:
- the symbol, which is hyperlinked to its SlopeChart
- the company name
- the market capitalization
- the dividend yield
- the price/earnings ratio
- the average volume for the past 200 trading days
- the most recent price
Clicking any of these columns will toggle the sort for the data beneath. Cool, huh?
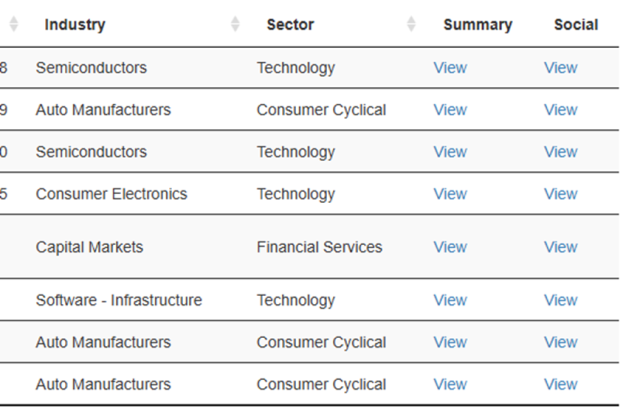
The right side shows the industry, the sector, a hyperlink to the Super Summary for that symbol, and a hyperlink to the Socialtrade stack for that symbol.
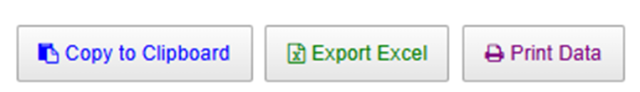
You will also have three buttons that allow you to preserve the results. You can copy the text to your clipboard, export the file to open in Excel, or print out the results.
I’m delighted with the progress we’ve made so far, and I’d appreciate hearing your feedback!
