
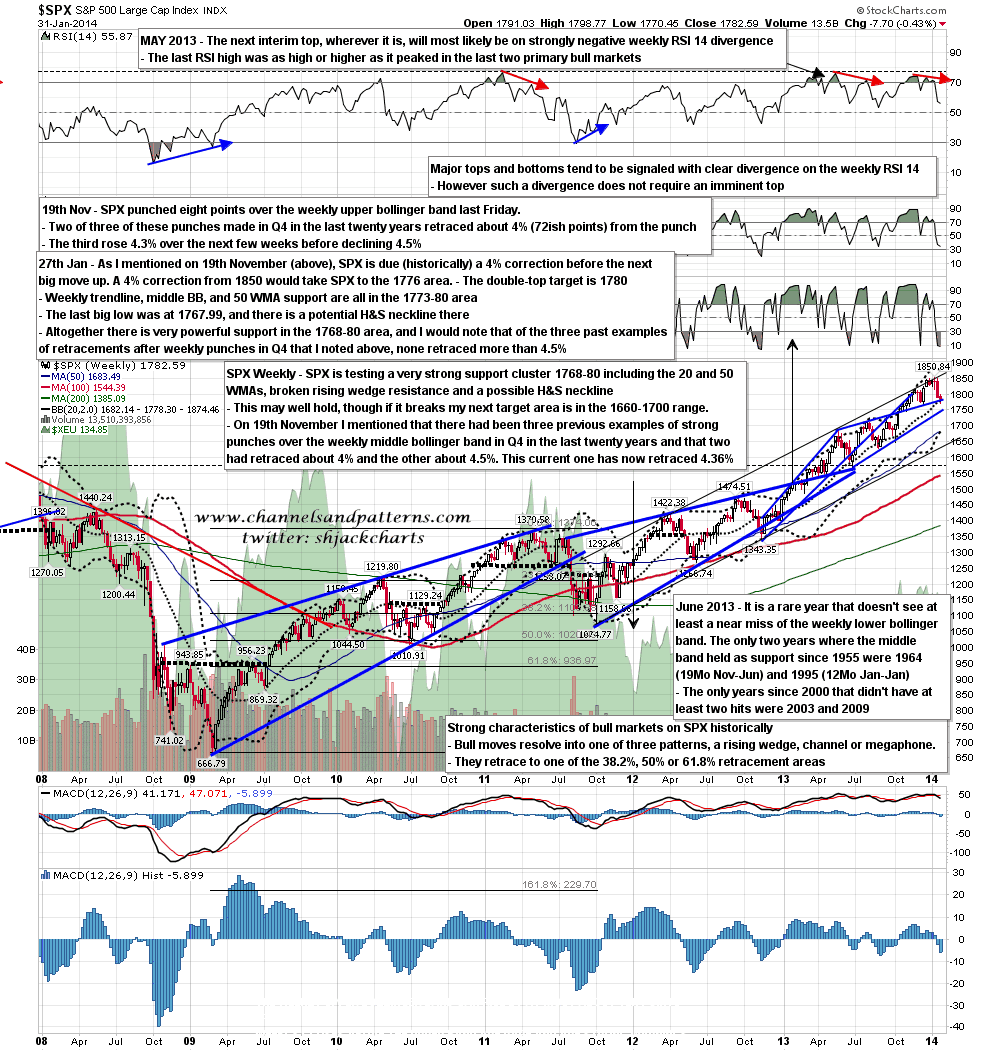
I have commented a couple of times that the left shoulder on the possible H&S forming on SPX took five weeks to form, and that I would expect any right shoulder to take at least two weeks to form. To that extent the very hesitant action at the current lows is not yet a bad fit with this scenario, though it may yet break down towards the next targets without making that right shoulder. If we do see a clear break down below the December low at 1667.99, then I have the next obvious target area slightly under 1700, and that could be reached quickly. SPX weekly chart:
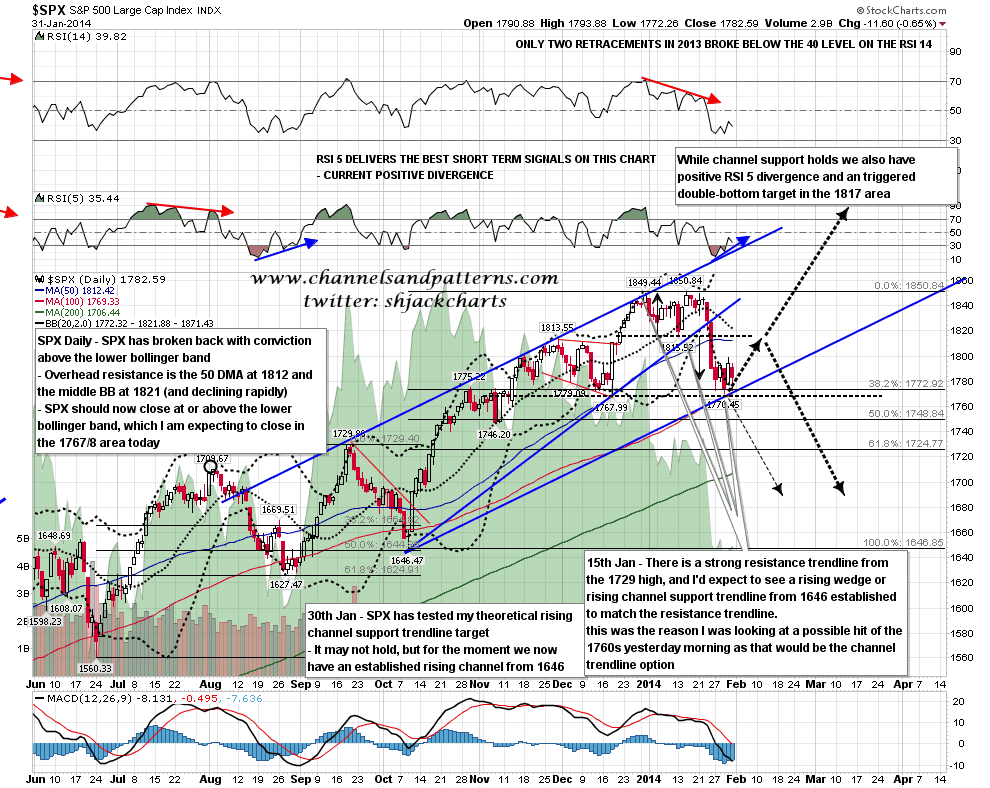
However for the moment at least the rising channel from the 1646 low is holding, and SPX has now closed back above the daily lower bollinger band twice. Historical stats strongly favor SPX continuing to close above the daily lower band until there has been a test of either the 50 DMA (currently 1812) or the daily middle band (currently 1821 and falling fast). I am expecting the daily lower band to close at worst in the 1667/8 area today so downside today looks limited. SPX daily chart:
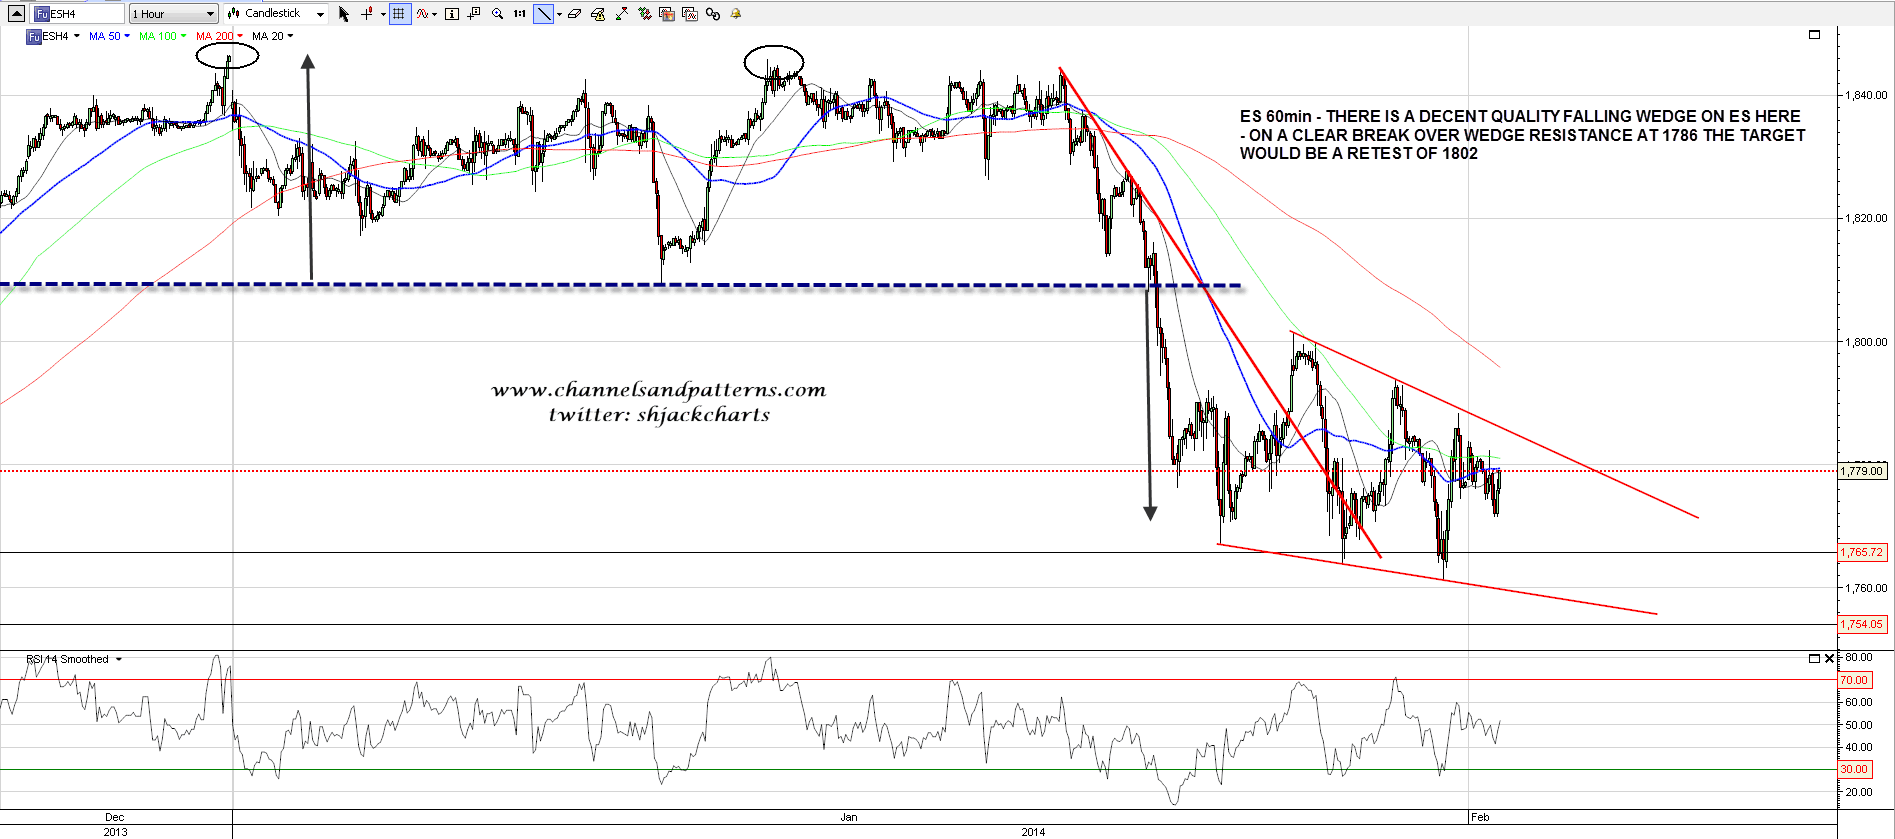
I don’t currently have a decent bottoming pattern on SPX, but I do have an interesting falling wedge from the 1802 rally high on ES. On a break over 1786 ES today the wedge target would be a return to 1802, and the narrow miss of wedge resistance on Friday is suggesting that we will see a break up today or tomorrow. ES 60min chart:
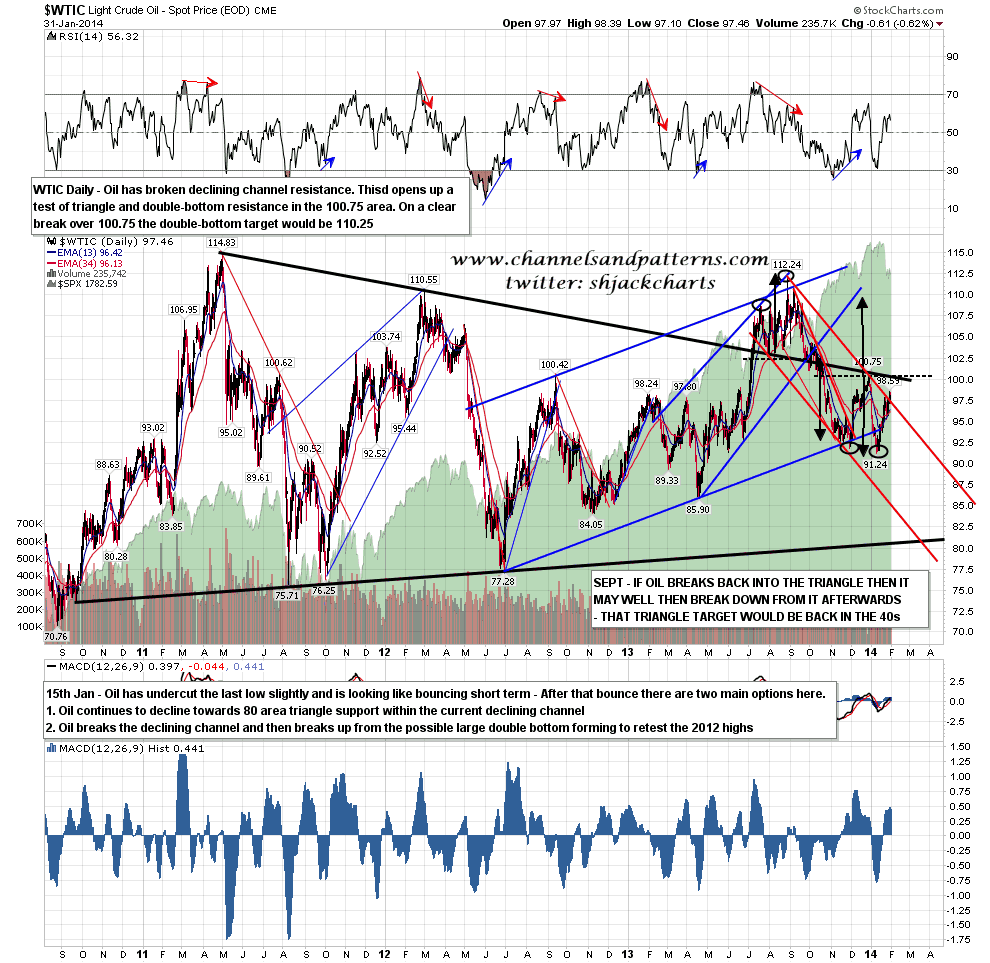
On other markets oil has broken the declining channel and the next obvious step is a test of triangle resistance and the possible double-bottom trigger level at 100.75. Oil might well reverse at strong resistance there, but on a sustained break over 100.75 the double-bottom target would be in the 110.25 area. WTIC daily chart:
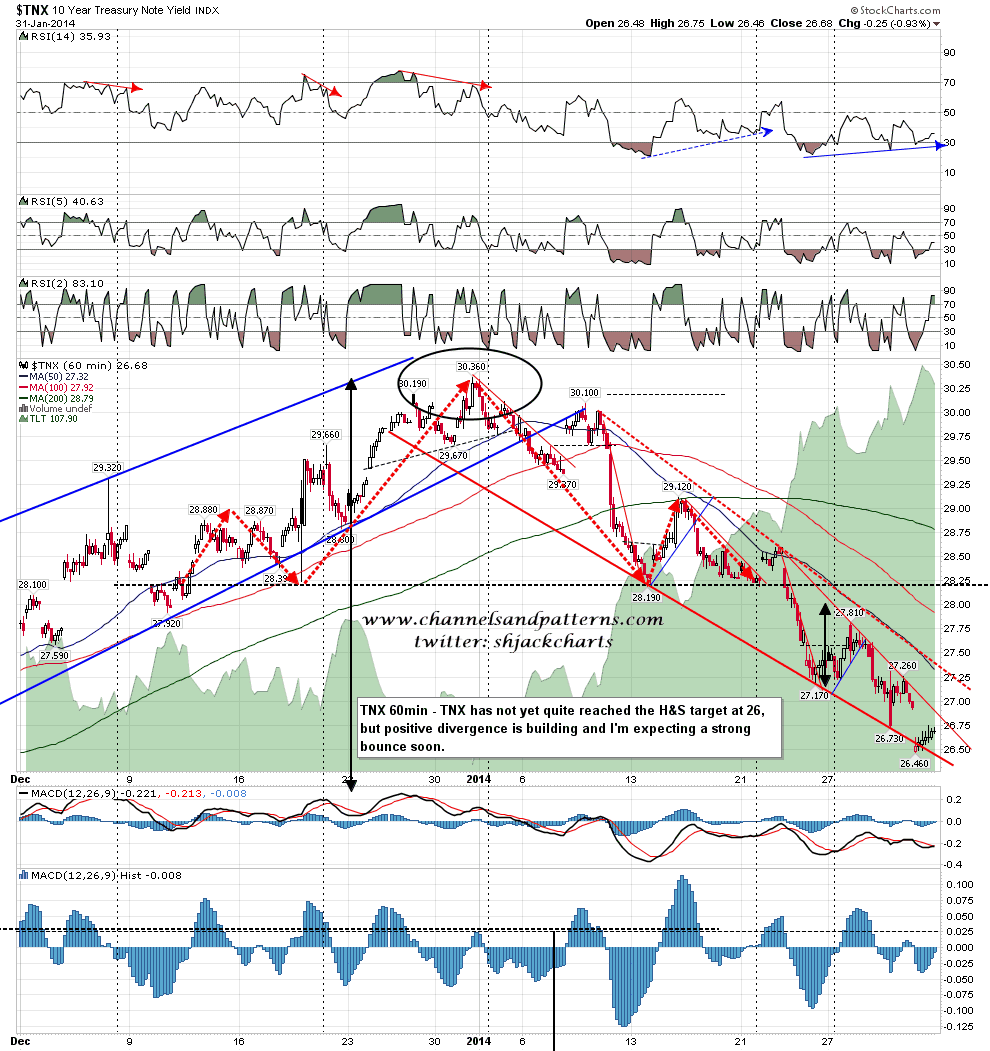
Positive divergence is building on the TNX 60min chart and I am expecting a strong bounce soon. The H&S target at 26 has not yet been hit however and may well be hit before that bounce. TNX 60min chart:
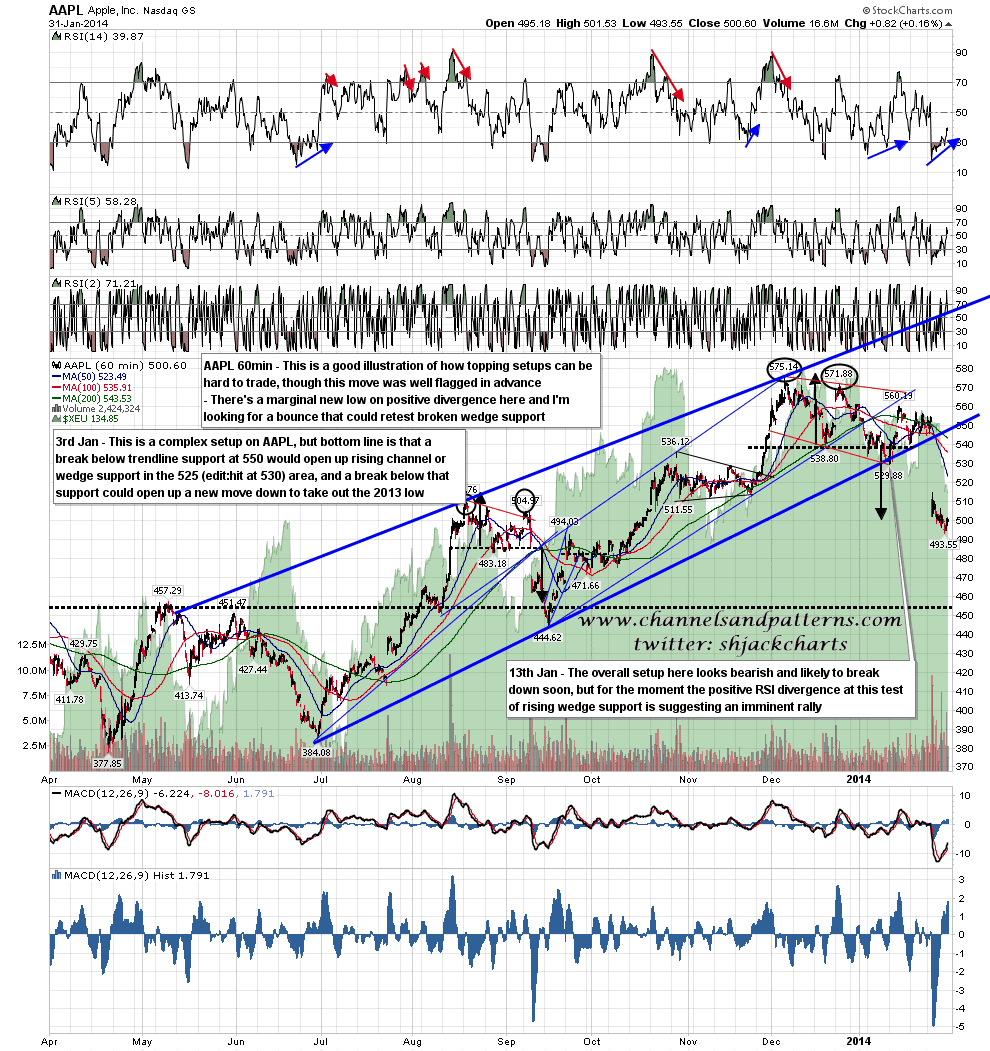
AAPL is making marginal new lows on increasingly positive 60min RSI divergence. I’m looking for a decent bounce soon that could retest broken rising wedge support. AAPL 60min chart:
The stats for today are historically very bullish. The Stock Trader’s Almanac blog tells us that Dow and S&P have been up 10 of the last 11, so today is a test to see whether the bulls can make any progress towards the 50 DMA at 1812 SPX. If we instead just continue to bump along the lows that will be a significant sign of weakness. I’ve never been much of a fan of the January Barometer that states that the trend in January sets the trend for the year, and would note that this has not been the case for five of the last fourteen years, but for what it’s worth the significant decline in January has given a strong bear signal for 2014 to those who take this indicator more seriously.
