
I’ve got some fun news to share about data. Yeah, I know – – Data? Fun? Hey, in my world, that’s a thing.
We finally have put/call ratio data. To be clear, there’s a bit of spit ‘n’ polish left to do, such as making the proper name show up, and using sensible symbols, but I wanted to share this information with you even in its alpha form and simultaneously ask for your opinion. You should be able to play with this data immediately.
For those wondering what put/call ratio data is all about, I’m going to be lazy and let Grok explain it:
The put/call ratio is a technical indicator used in financial markets to gauge investor sentiment, particularly in options trading. It measures the volume of put options traded relative to call options over a specific period, typically calculated as:
Put/Call Ratio = Volume of Put Options ÷ Volume of Call Options
Key Concepts:
- Put Options: Contracts that give the buyer the right, but not the obligation, to sell an underlying asset (e.g., a stock or index) at a specified price (strike price) before or at expiration. Investors buy puts to hedge against price declines or speculate on a drop in the asset’s value.
- Call Options: Contracts that give the buyer the right, but not the obligation, to buy an underlying asset at a specified price before or at expiration. Investors buy calls to bet on or hedge against price increases.
- Ratio Interpretation: The put/call ratio reflects the balance of bearish (put) versus bullish (call) sentiment in the market:
- High Put/Call Ratio (>1): Indicates more put volume than call volume, suggesting bearish sentiment (investors are betting on or hedging against price declines). It can signal oversold conditions or fear in the market, sometimes viewed as a contrarian buy signal.
- Low Put/Call Ratio (<1): Indicates more call volume than put volume, suggesting bullish sentiment (investors expect prices to rise). Extremely low ratios may signal overbought conditions or excessive optimism, potentially a contrarian sell signal.
- Neutral Range: Typically around 0.7 to 1.0, depending on the market or index (e.g., S&P 500, CBOE). Ratios vary by asset and context.
Types of Put/Call Ratios:
- Equity Put/Call Ratio: Focuses on options for individual stocks. It’s often noisier due to company-specific events.
- Index Put/Call Ratio: Tracks options on broad market indices (e.g., S&P 500). It’s a better gauge of overall market sentiment, as institutions often use index options for hedging.
- Total Put/Call Ratio: Combines equity and index options for a broader view, often reported by exchanges like the CBOE.
- Open Interest Put/Call Ratio: Uses open interest (outstanding contracts) instead of trading volume, reflecting longer-term sentiment.
How It’s Used:
- Sentiment Indicator: A high ratio may indicate fear or pessimism, while a low ratio suggests optimism or complacency.
- Contrarian Signal: Extreme ratios can signal potential reversals. For example:
- A very high ratio (e.g., >1.5) might suggest the market is overly bearish, potentially leading to a bounce.
- A very low ratio (e.g., <0.5) might indicate excessive bullishness, potentially preceding a pullback.
- Context Matters: Ratios should be compared to historical averages for the specific asset or index, as “normal” levels differ. For instance, the CBOE S&P 500 put/call ratio often averages around 0.7–1.0.
Example:
- If 100,000 put options and 80,000 call options are traded on the S&P 500 in a day:
- Put/Call Ratio = 100,000 ÷ 80,000 = 1.25
- This suggests bearish sentiment, as more puts were traded than calls. If 1.25 is above the historical average (say, 0.9), it might indicate heightened fear, potentially a contrarian buy signal.
Limitations:
- Not a Standalone Indicator: Must be used with other technical or fundamental analysis, as ratios can be skewed by events like earnings or expirations.
- Market-Specific: Ratios for individual stocks may reflect company-specific news rather than broad market sentiment.
- Lagging Nature: Volume-based ratios reflect past trades, not necessarily future moves.
We’ve got seven different flavors of this. Above each chart I am showing the symbol we’re going to use (it’ll work soon but may or may not work when you try this), the name, and the silly-ass symbol I’m using right now (which, again, may not work if the proper symbol is up and running). Also please note you have to put SlopeCharts into “line chart” mode (which will be automatic by tomorrow).
Here we go:
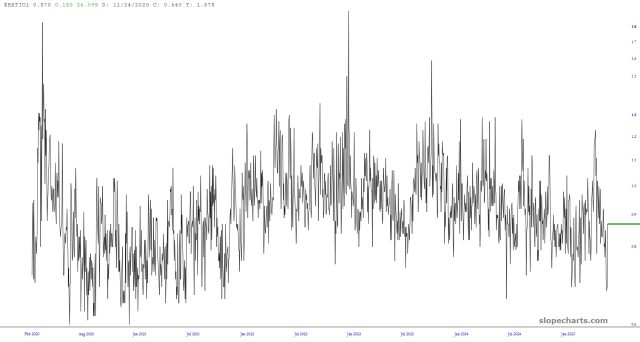
$TPCR – Total Put/Call Ratio (currently $RATIO01)
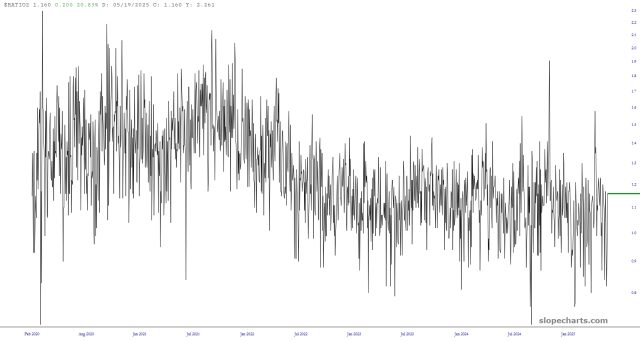
$IPCR – Index Put/Call Ratio (currently $RATIO02)
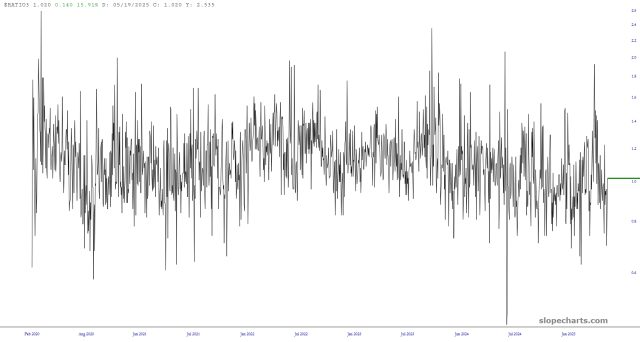
$ETPC – Exchange Traded Products Put/Call Ratio (currently $RATIO03)
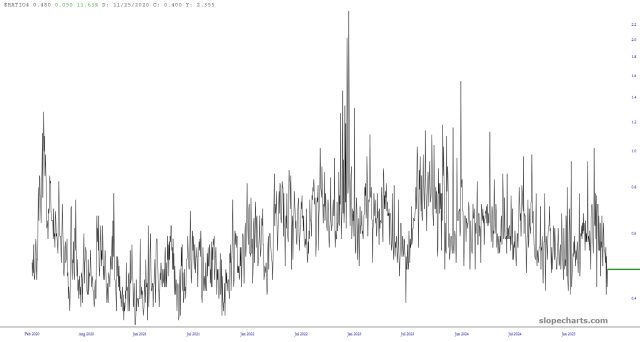
$EQPC – Equity Put/Call Ratio (currently $RATIO04)
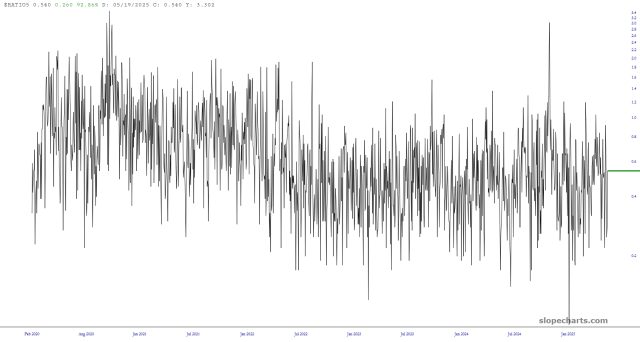
$VXPC – VIX Put/Call Ratio (currently $RATIO05)
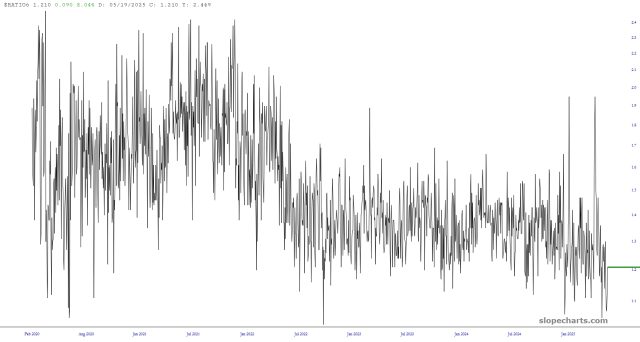
$SPPC – S&P 500 Put/Call Ratio (currently $RATIO06)
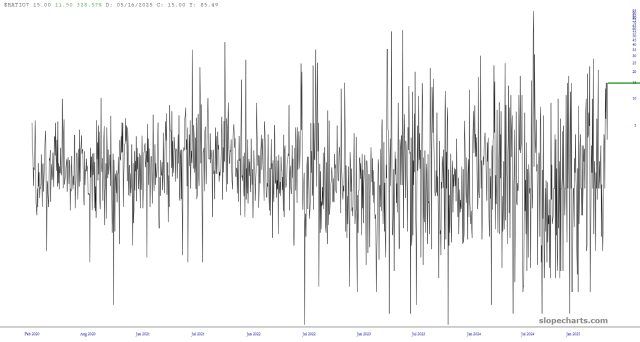
$OEPC – S&P 100 Put/Call Ratio (currently $RATIO07)
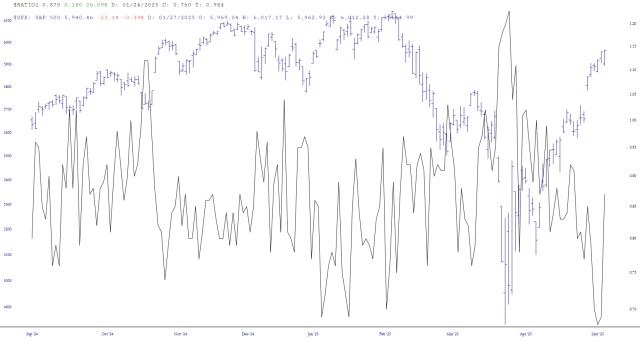
As an example of using this in real life, below is a snapshot of recent P/C ratio data overlaid with the S&P 500 index using our layered charts mode:
I would be very interested in your opinions about this data, for those of you who have used it before. Are there any of these particular data types you have found particularly useful? Are there any specific applications or approaches you’ve taken with this data?
I look forward to reading your feedback.
