
I’ll take this opportunity to remind you that SlopeCharts has a variety of interesting Statistics you can use to examine underlying market strength and sentiment.
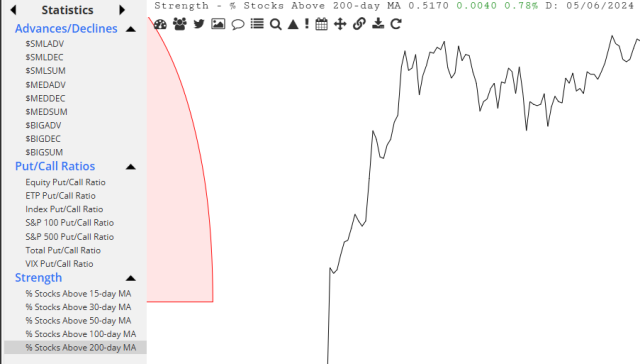
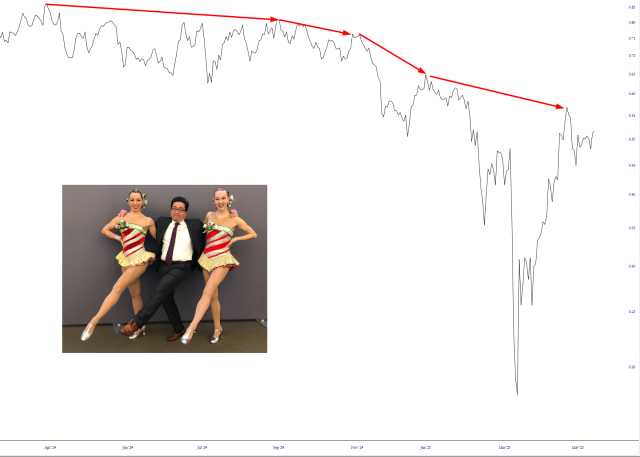
One in particular I’ll share now is the percentage of stocks above their 200-day moving average (which is the easy-to-remember symbol $SPX200MA). Looking at this data from the start of 2024, it’s plain to see that, yes, the market has roared off its lows from two months ago, but every single thrust higher has merely resulted in a lower, weaker “achievement“, only to be followed by more selling.
Even so, I am beyond shellshocked at what’s happened since April 7th, and my exposure is vanishingly small, which means that should another hard swoon start, you will see steam coming out of my ears.
