As big a fan as I am of gold and silver, this chart of $XAU – the gold miners index – caught my eye. The tinted portions indicate major points of resistance, measured over many years, and it was compelling enough for me to short GDX.
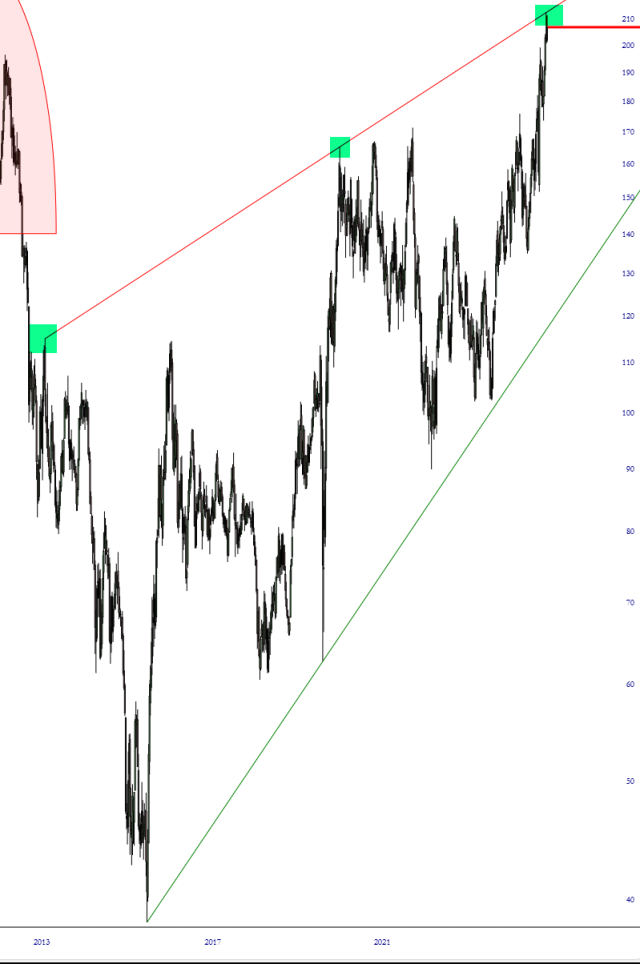
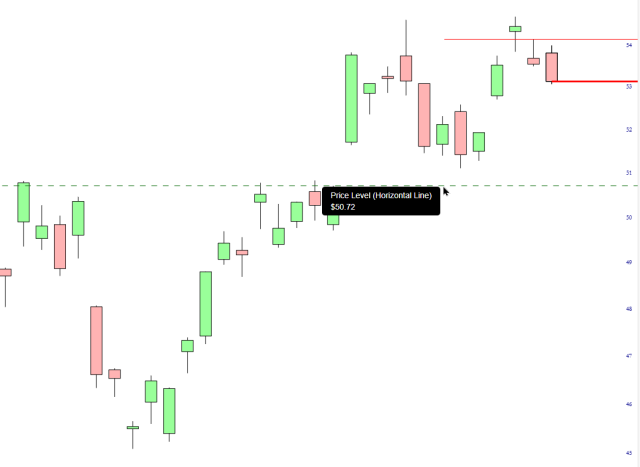
Looking closely at GDX, we can see at the moment a bearish engulfing pattern. I’ve tightened up my stop to yesterday’s high, and the very first target is down at the 50.72 price gap. Take note that the “peak to trough” timespan on the $XAU chart spans YEARS, so this isn’t going to be a short-term trade. I might hang on to it for a while.
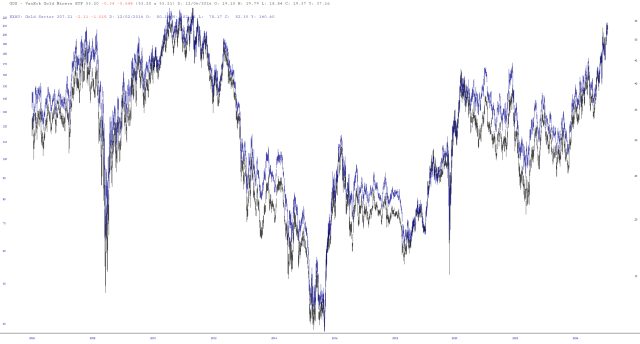
If you are curious how well GDX and $XAU track one another, look no farther than the layered chart, and you can see they move in lockstep.