
……But Then It May Go Higher
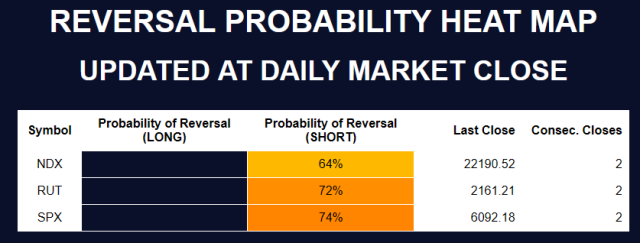
Good morning everyone, here is the updated DAILY HEAT MAP for probability of reversal for SPX,NDX and RUT indices, after yesterday’s DAILY Close: all the 3 indices are short-term overbought according to my statistical pattern trend model. They can certainly go higher, but one can start to try short trades from here.
I am a big fan of Vertical Spreads (BearCALLs, BullPUTs) because you can enter the trade exactly at the close, and that goes hand-in-hand with my time model (consecutive closes in one direction), and as long as the next close is 0.01 point away from your Strike, you will profit.
So with Vert.Spreads Options you do not need to predict the extension of the price move, it simplifies your forecast, it makes it more “robust” because you have one less variable to consider (i.e. no price variable).
If we want to make the forecast a bit more complex (and inevitably less robust), we add the price variable into the equation, as follows:
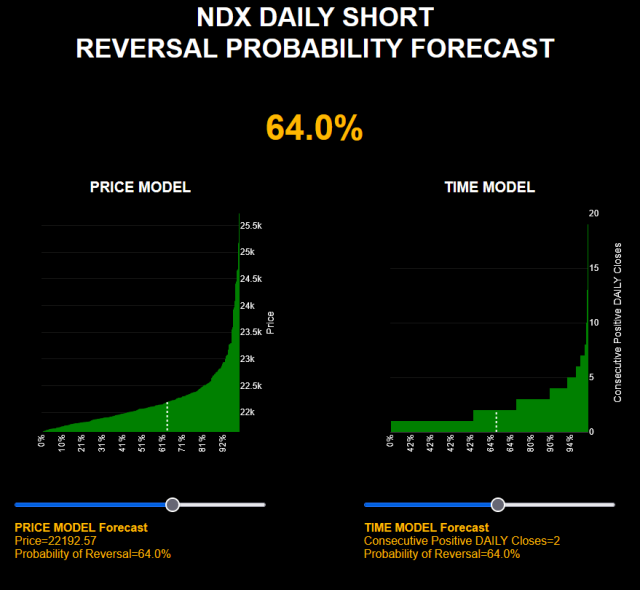
In this case, the right-hand side displays the price model, while the left-hand side shows the time model. The combined average probability of a reversal for today is 64%—not extremely high, but starting to become interesting.
A useful visual cue from the time model is the staircase-like pattern: up to 3 consecutive days is relatively common (notice the first three prominent steps from left to right). Beyond that, each additional step becomes noticeably smaller, indicating that such extended streaks are increasingly rare.
Conclusion: Placing an ATM NDX Bear Call spread with 1-day expiry after the second consecutive up close offers a decent probability of success. The same setup can be repeated at today’s close—following a third consecutive up close—with an even higher reversal likelihood.
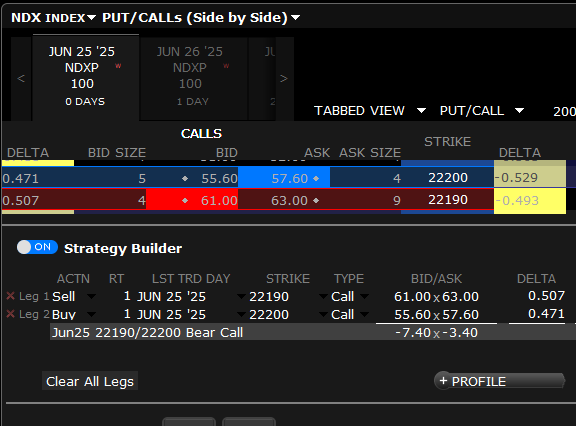
To achieve full profit, all that’s needed is for the NDX to close below 22190 (e.g. at 22189.99). So you need to be just a little bit right, you don’t need the market to tank to 21000.
Here below is the sample trade:
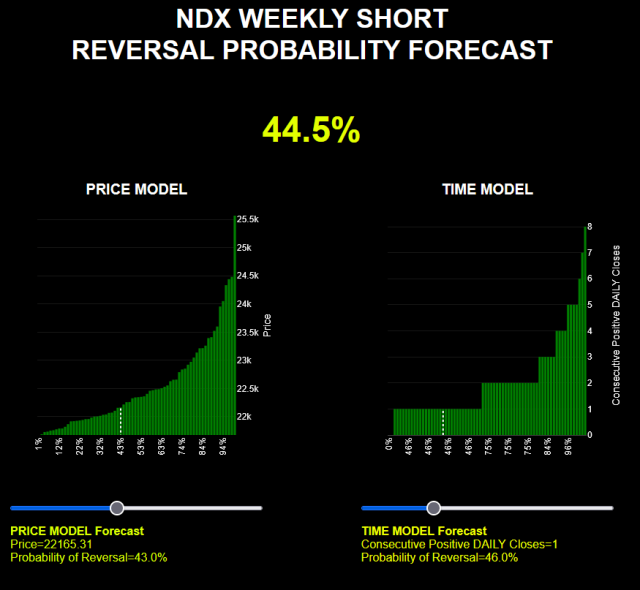
One last thought before I sign off: here below you can see the WEEKLY SHORT model.
The NDX is NOT overbought WEEKLY.
This means it can pullback DAILY (because is overbought DAILY) but then it can go higher in the following days (WEEKLY, not overbought).
Try to imagine a subwave DAILY within a larger WEEKLY wave, that is how it works.
Here is the WEEKLY model for NDX SHORT, definitely not overbought, can go higher:
If you want to get direct access to these tools, you can use this link.
Use ‘SLOPEOFHOPE’ coupon to get a perpetual 30% discount on the monthly access cost.
