
Last Friday, November 7th, the market made a short-term bottomed and rallied the next three days (culminating in a record high for the Dow on both Tuesday and Wednesday) before it fell to pieces again on Thursday and, briefly, Friday morning. It’s possible that we’re going to go through the same circus again, with Friday’s low marking a short-term bottom. Let’s catch up with some ETFs to think it through.
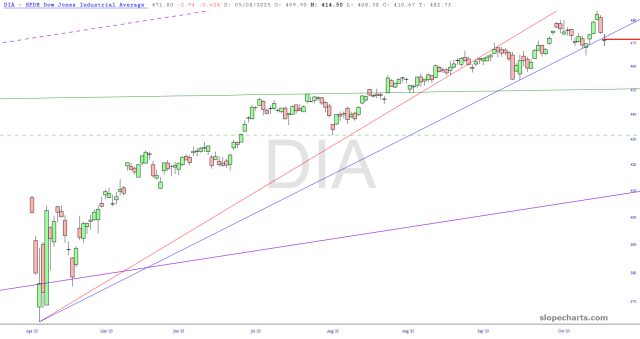
The Dow ETF has cracked its uptrend only twice: the past two Fridays. I’ll breathe easier once we are clearly below a broken trendline instead of just teasing it.
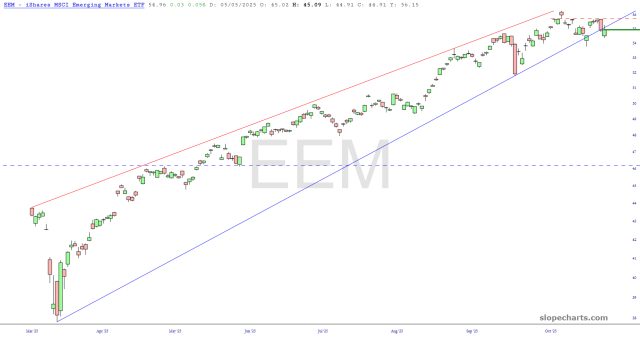
The emerging markets likewise fractured the uptrend over the past two Fridays. Interestingly enough, this fund closed precisely at the damaged trendline.
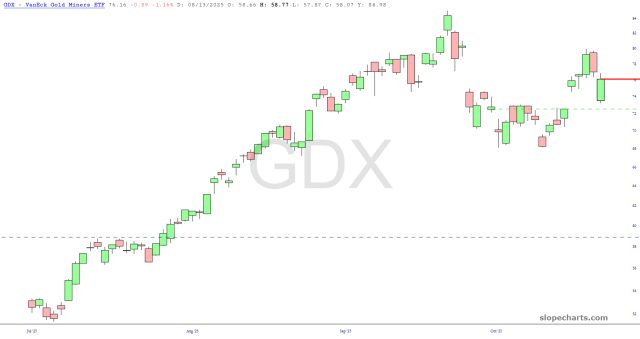
The miners are in a very short-range lockbox: for support, we have the gap represented by the horizontal (held up by a couple of weeks trading beneath); for resistance, we have the trading activity on Wednesday and Thursday. Friday’s activity spanning pretty much this entire range.
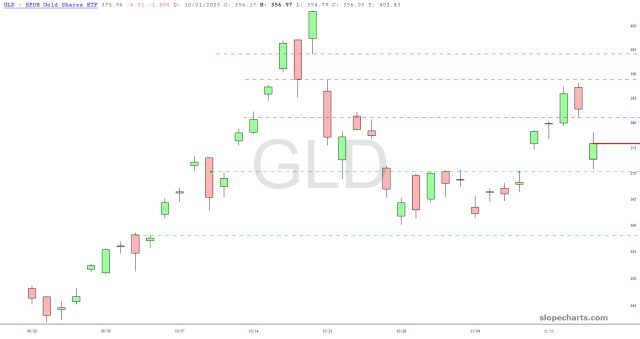
Gold itself is similarly situated, with support at the green horizontal and a trio of resistance levels above. I have no positions at all in precious, with the minor exception of being long a small quantity of DUST in anticipation of a breakdown in precious.
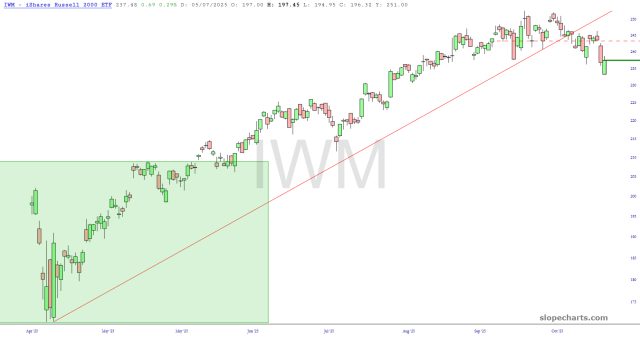
The small caps are much clearer: they have absolutely broken below their uptrend. Major resistance is shown at Wednesday’s low (the price gap).
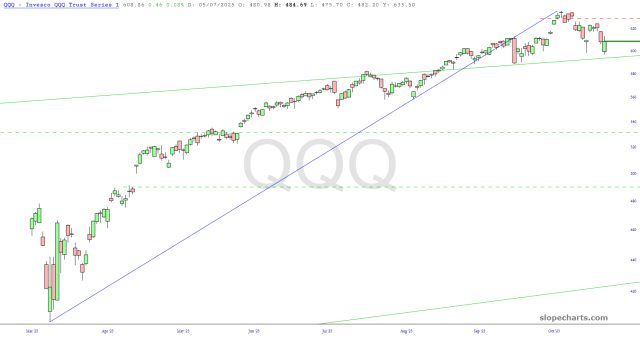
The NASDAQ has also terminated it uptrend and is now range-bound. The green (support) and red (resistance) lines define the range, and a breakout of it will dictate the new direction for tech stocks. A break of support would open up plenty of potential downside, and of course NVDA’s report on Wednesday afternoon will probably make or break that decision.
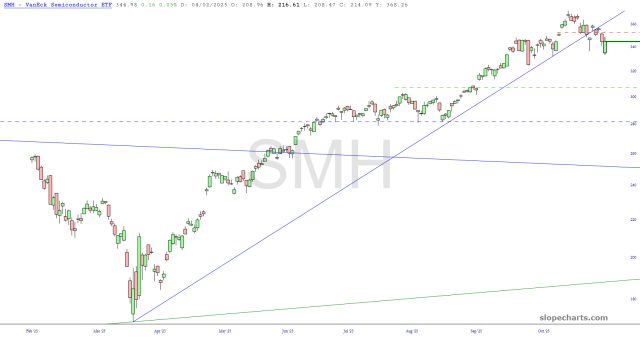
At long last, the semiconductors have completely broken their uptrend. The AI Mania has clearly soured, and the more folks wring their hands about the (literally) trillions of dollars required to fully realize the AI dream, the weaker all associated companies will become.
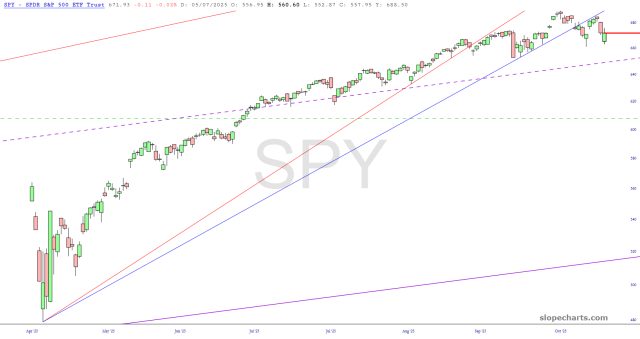
I’ve provided two trendlines for the S&P 500 ETF, both of which have been busted. The dashed trendline you see represents the midline of the channel representing the ENTIRE uptrend since the March 2009 bottom. In other words, slipping below that dashed line would confirm a pretty serious downturn was underway.
Out of concerns over any short-term bounce, I dialed my exposure back from almost 200% to 110%. I will amp up my positions if it’s clear that no such short-term bounce is forthcoming. To be clear, this week is going to be all about NVDA, so trading could be muted, particularly on Wednesday itself before all holy hell breaks loose Thursday at the open.
