
I haven’t done much since April since this market decided that tariffing the fuck out of everyone was suddenly a good thing (It wasn’t). So, I stepped away from doing too much trading for the most part. But we are finally seeing some potential action in the markets that can make for decent swings and shorts in coming months.
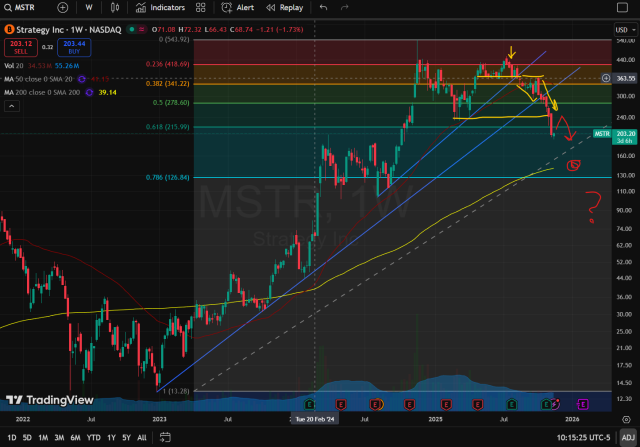
I have to start with this one as a celebration of sorts. This was my best trade ever. And as a bonus, I marked the spot where I first noted the potential drop in my post from July 25 (Party Like Its 1999). This worked out beautifully. The topping pattern was picture perfect, as was the initial break beneath important MA/technical levels and subsequent rejection. I mostly rode this down towards 180 (which it did not hit, but close enough), covering in bits and pieces at a few key spots to book profits. I just recently exited my position and am looking to reload after a bounce. I am aiming for between 235-245 area. I think we are today seeing a squeeze to push out weak recent shorts that will pop us back up to those levels where more experienced traders will be selling.
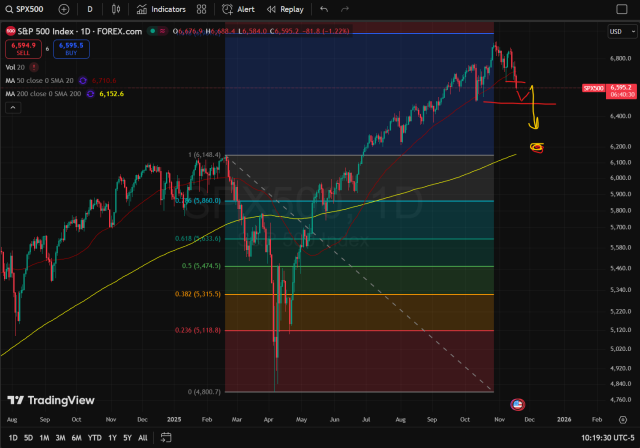
Back to broad market index. I’ve recently mentioned the two-week range which had its bottom set at 6650. We just started trading beneath it and are fighting to stay above 6600. I’m looking for an initial test of 6500 where we should see a bounce into end of year, Santa Clause rally and all. But the bear in me wants to see 6650 to continue to hold as resistance. We shall cross that bridge when we come to it. For now, the short-term play is to short with stops at that level until we get a decent downdraft towards 6500. Medium term, if these levels prove to be a true turning point, I’m looking for a dump towards prior highs before the Tariff Tantrum, around 6100-6150.
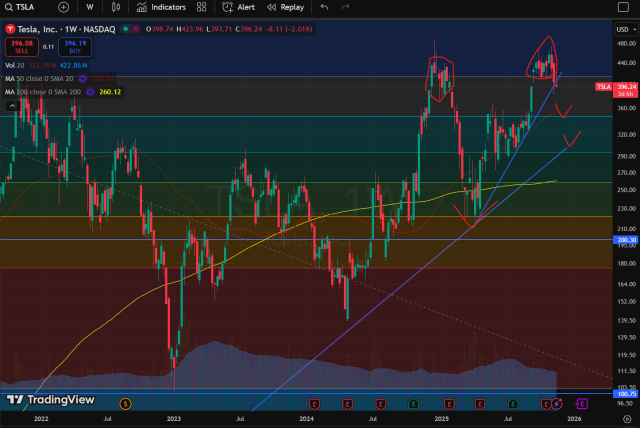
This one likes to mess with my head, but I think I’ve got it wrangled this time. The topping pattern recently looks similar to the prior topping pattern at this same area. The breakdown last time met with a very large drop towards the long-term ascending trendline. I think a similar breakdown could occur. Short-term support should be at most recent breakout level at 350 area. But the larger picture feels like this bounce could be short-lived and we again retest the trendline around 300. Beyond that, I’d need to see broad market failure take hold to feel bearish enough to take out that trendline (I’ve been sucked into that far too many times). The appropriate play would be to cover remaining shorts down there and possibly flip long. Again, cross that bridge when we come to it.
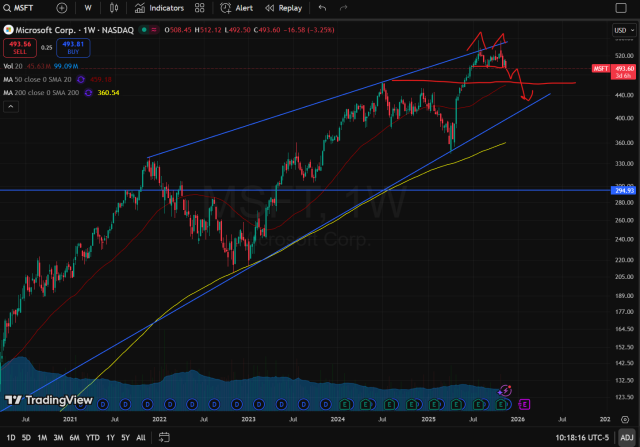
Tech shorting is back in style. This has been riding the upper end of this channel/trendline, getting smacked back down as it tries to escape. Now, if broke beneath the 50 Day MA at 510 (not shown), found support at 490 and retested/rejected that 50 Day MA. Now, weekly chart looks toppy and could see swift fall off this nice short-term pattern.
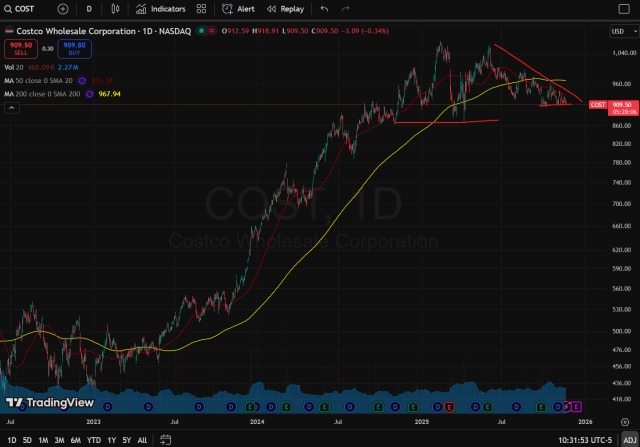
I was a Costco bull back in the 500’s area and it proved to be a good call. I admit I made this call and fervently pushed it, but made very little money off it as my head was not in the right space (I was busy losing money elsewhere). But now this is ready. Nice triangle pattern with resistance holding beneath 200 and 50 Day MA, sitting on support level. If this breaks down there are decently close support levels beneath it, so it wouldn’t just collapse, but it still may be worth a short if it breaks down. On the flipside, if we see this break above triangle trendline, then this could be a great long entry. So this is a “choose your own adventure” chart.
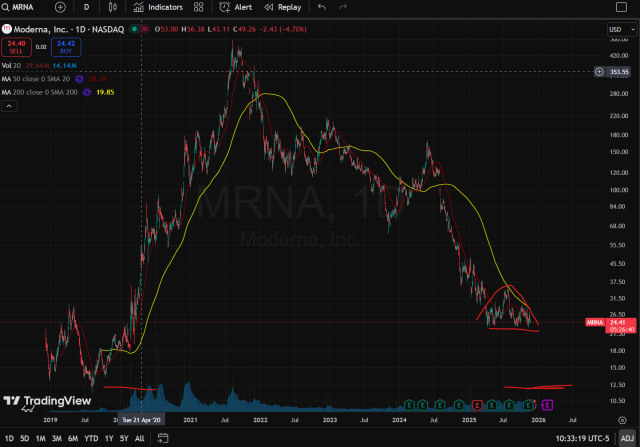
This is just waiting to breakdown. All prior bullishness was due to vaccines from Covid which has basically been removed from the American lexicon in the past two years. So, this pattern is now looking more and more bearish. The pattern tells me “down” with possible target towards $10-$12. But being this is technically a biotech company (or adjacent at least), it may be safer to play using puts rather than outright shorting as biotechs like to pop.
I’ll end with some bullish suggestions as well. I just mentioned biotechs as being susceptible to pops. They are often a strong sector when things are iffy, (speaking anecdotally here, I have not done an analysis or anything). That being said, some interesting long-term charts that look very bullish are REGN, BIIB, LLY, and MRK. Good luck in your trading throughout the rest of 2025 all. And Have a Happy Thanksgiving.
