I trust everyone is having a good long weekend. Let’s take a look at some major U.S. cash index charts.
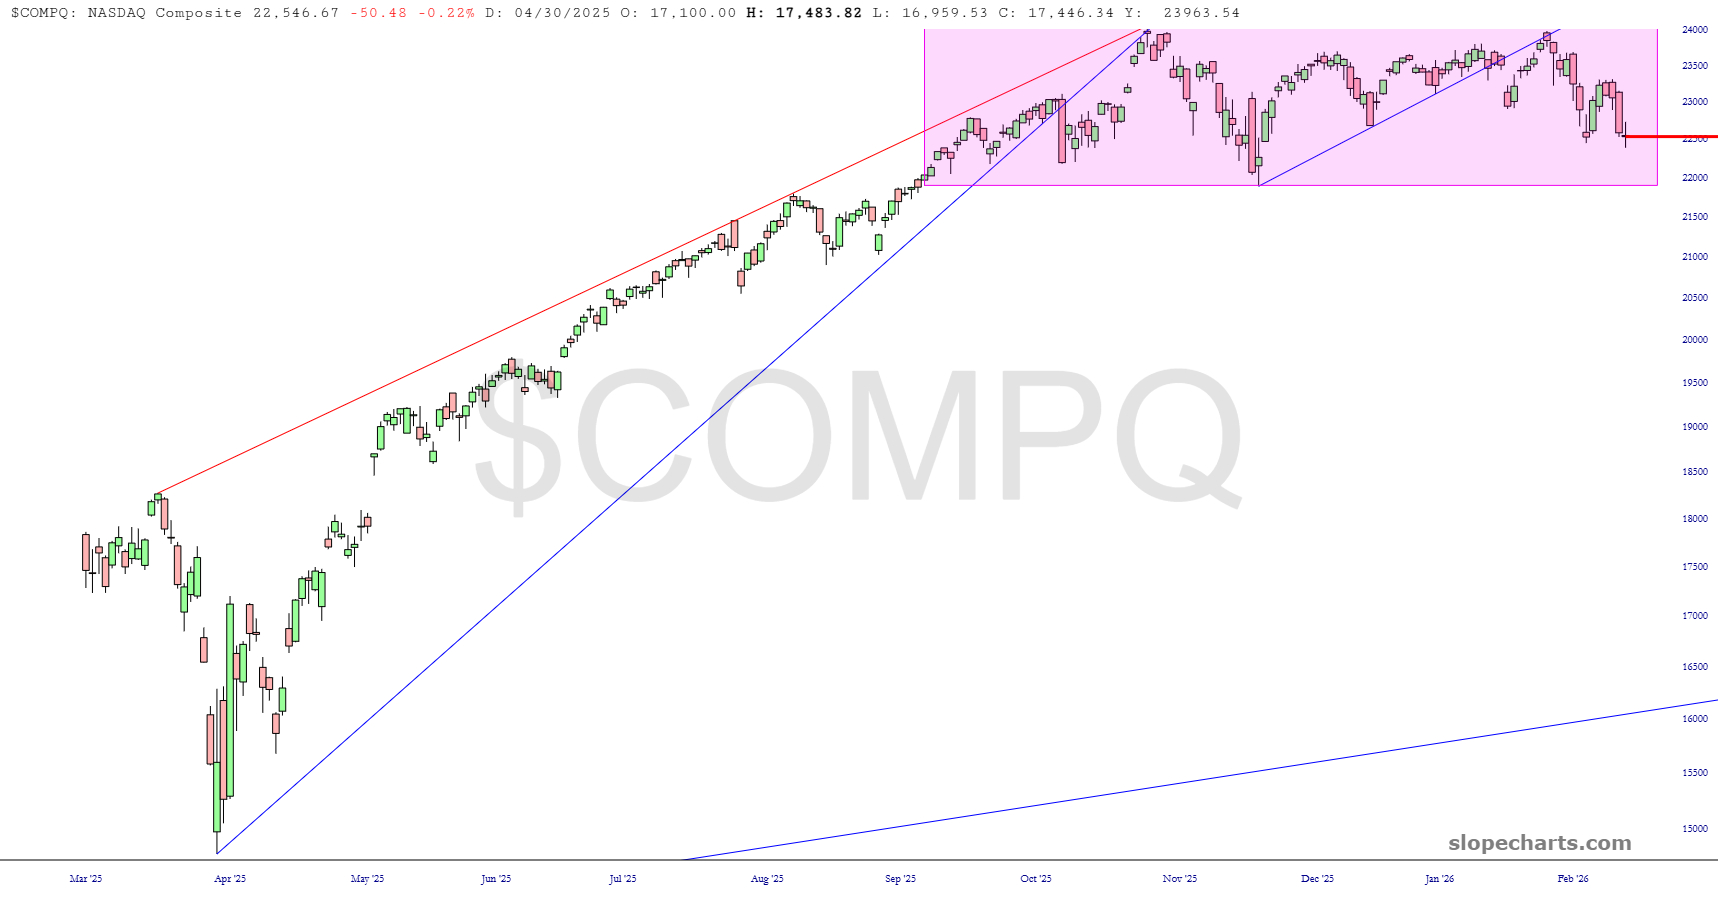
First up is the NASDAQ Composite. My spidey sense is that we are going to break below that range before this month is over, which should set off a handsome sell-offf.
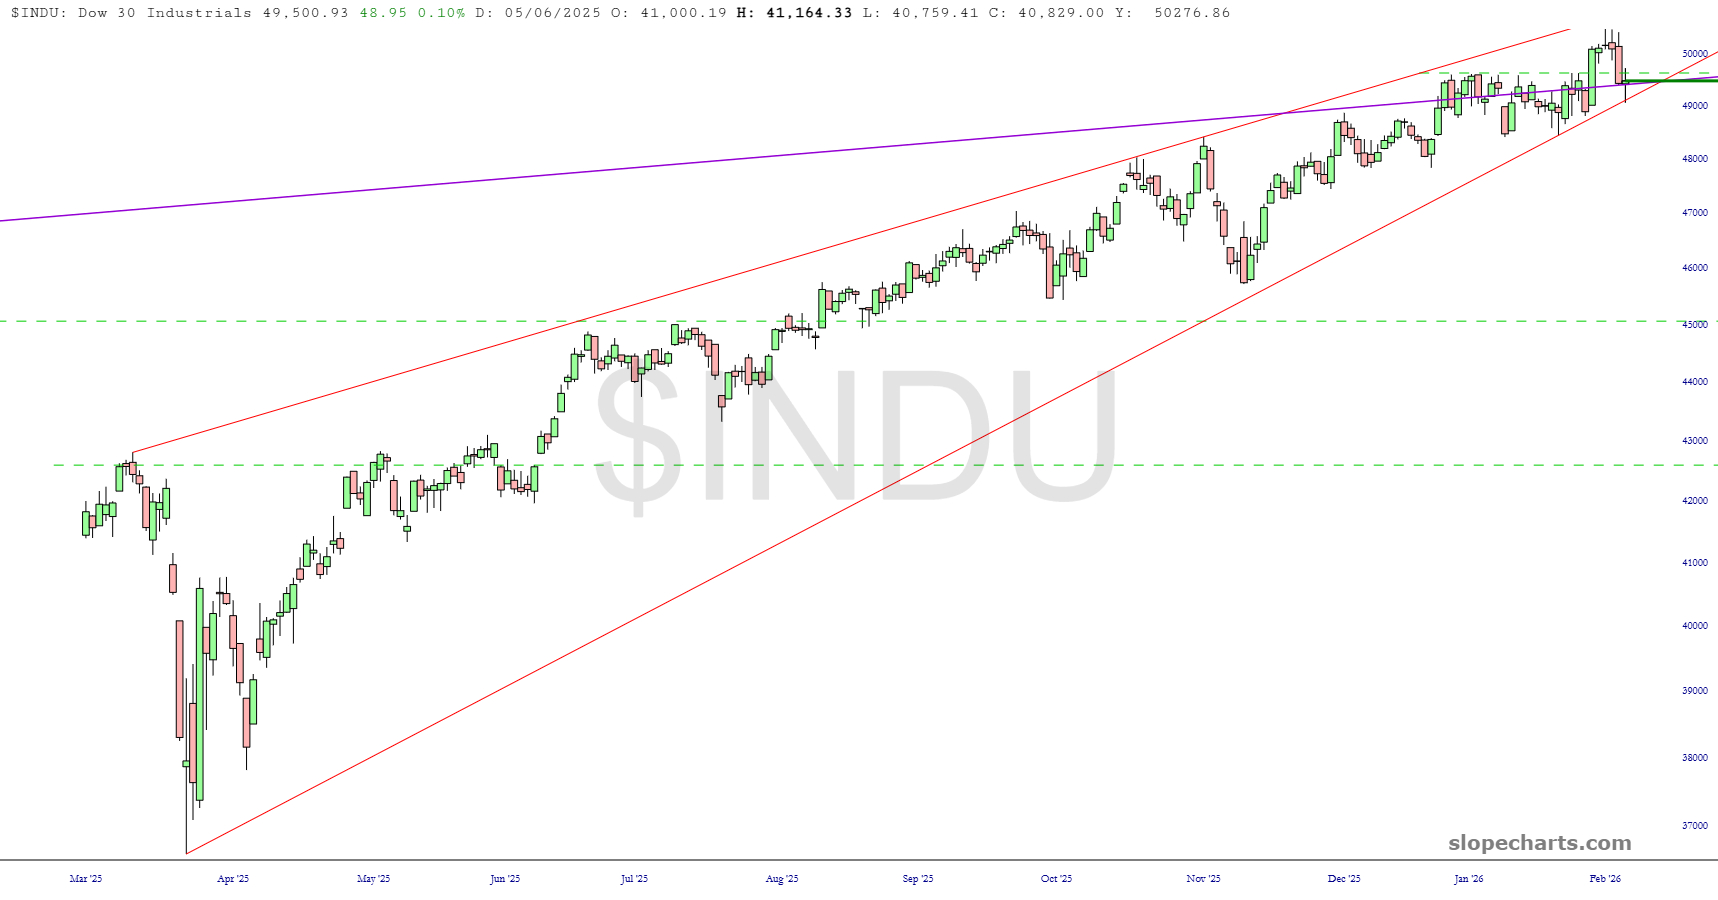
The Dow is precisely at a trendline that goes back, I kid you not, to 1932. A failure of this wedge pattern would get things rocking to the downside.
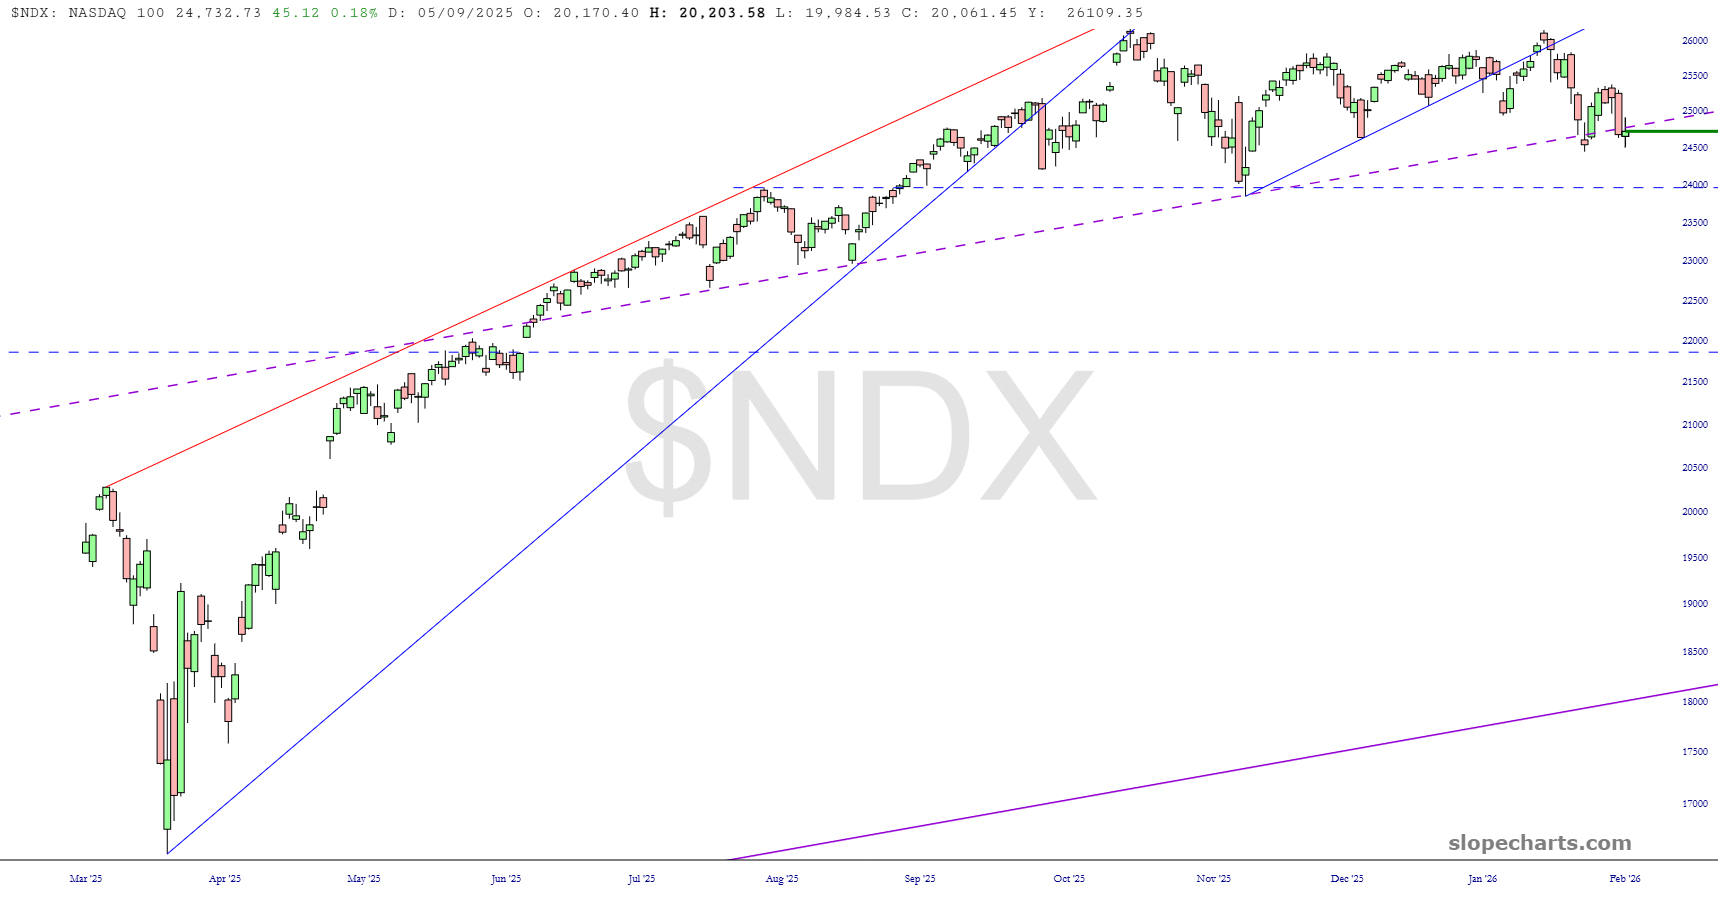
The NASDAQ 100 is barely hanging on to the dashed line, which is the midline of a multi-decade channel. In other words, this is an exceptionally important support level.
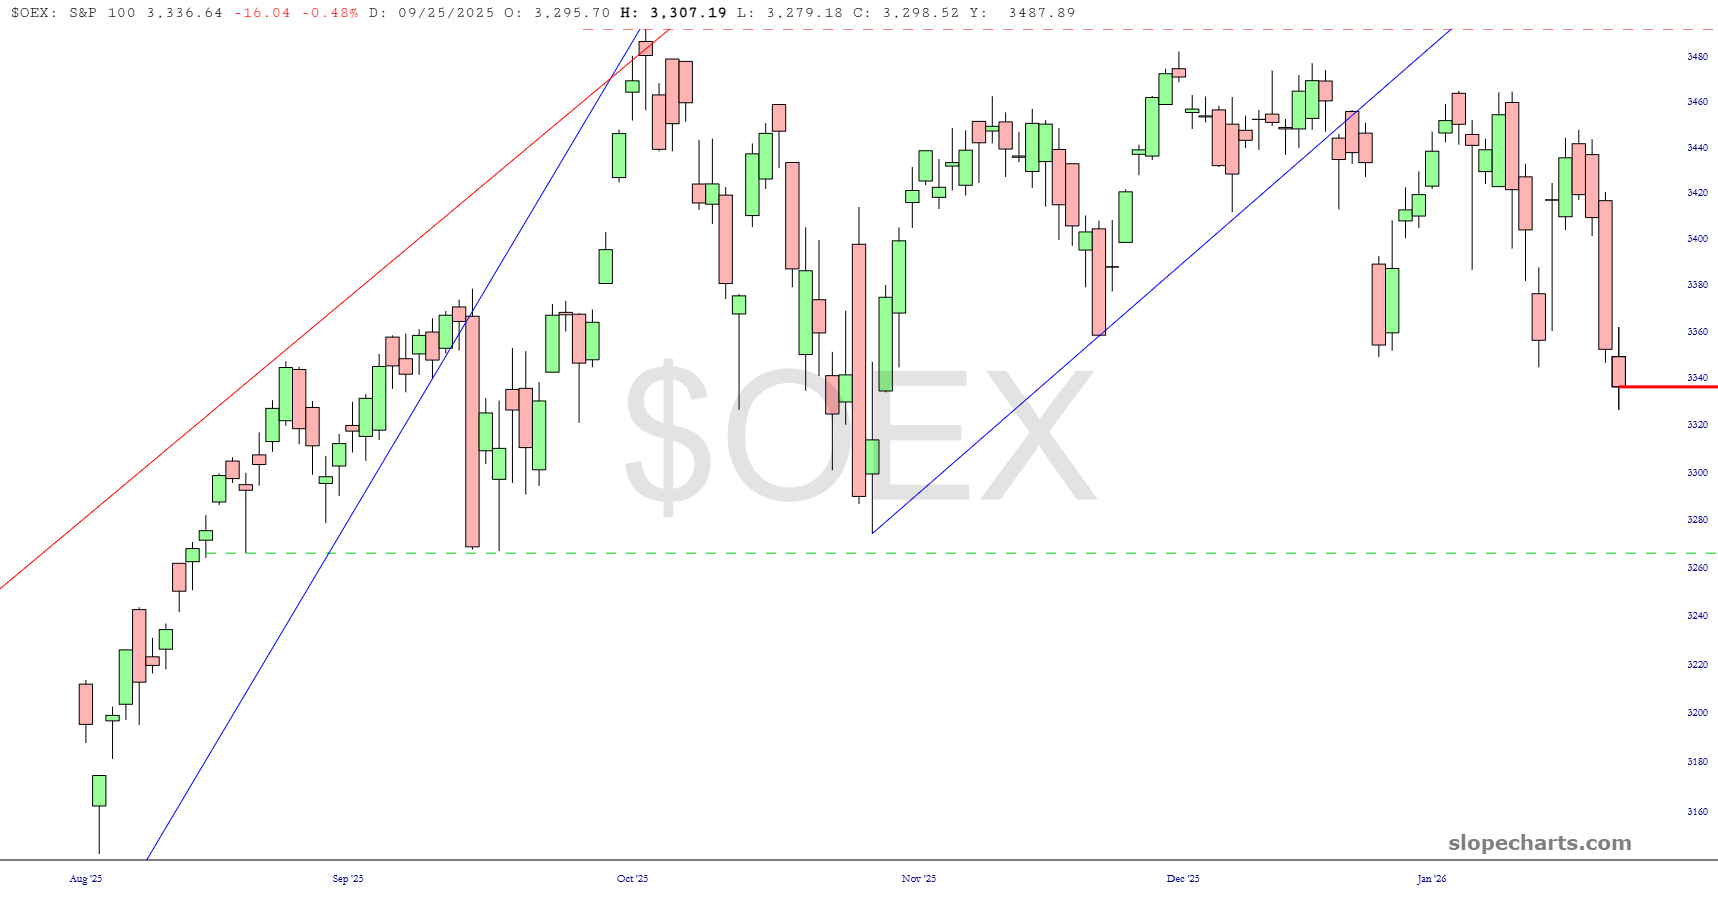
The S&P 100 has been rangebound for months. We are presently at what has been the bounce point for 2026. For obvious reasons, I would appreciate it if the market gods would allow this range to break.
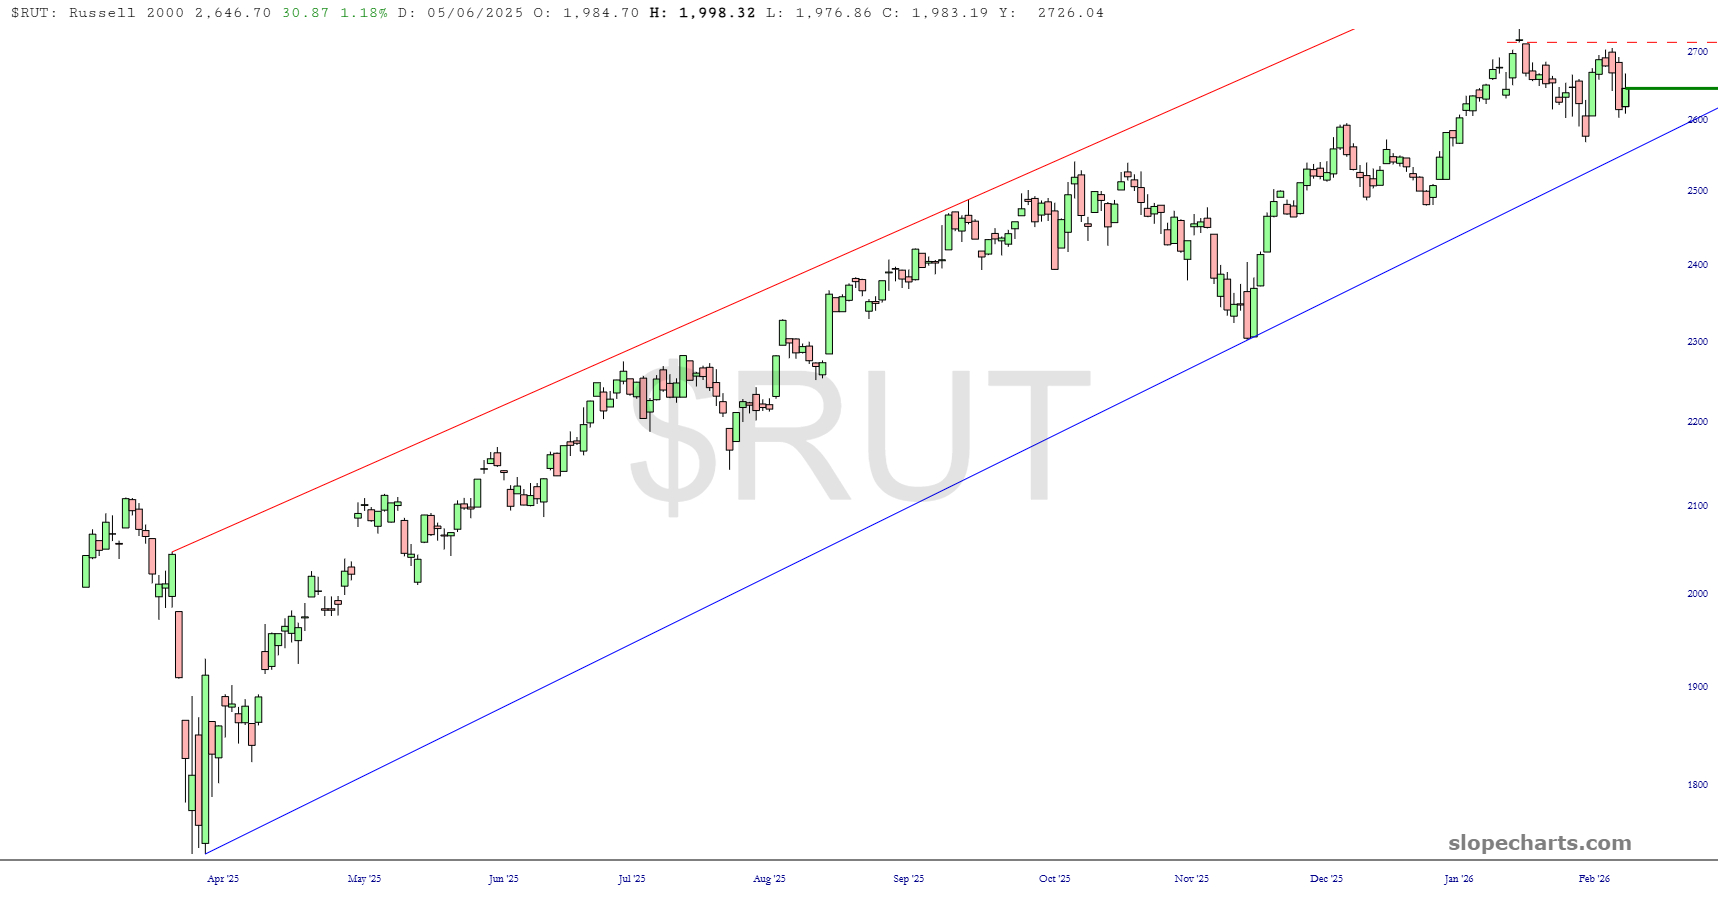
The Russell 2000 is neatly within the boundary of its ascending channel. For any bearish souls out there, the key is to to stay under the dashed line (representing the island gap) and, even juicier, to break the lower trendline.
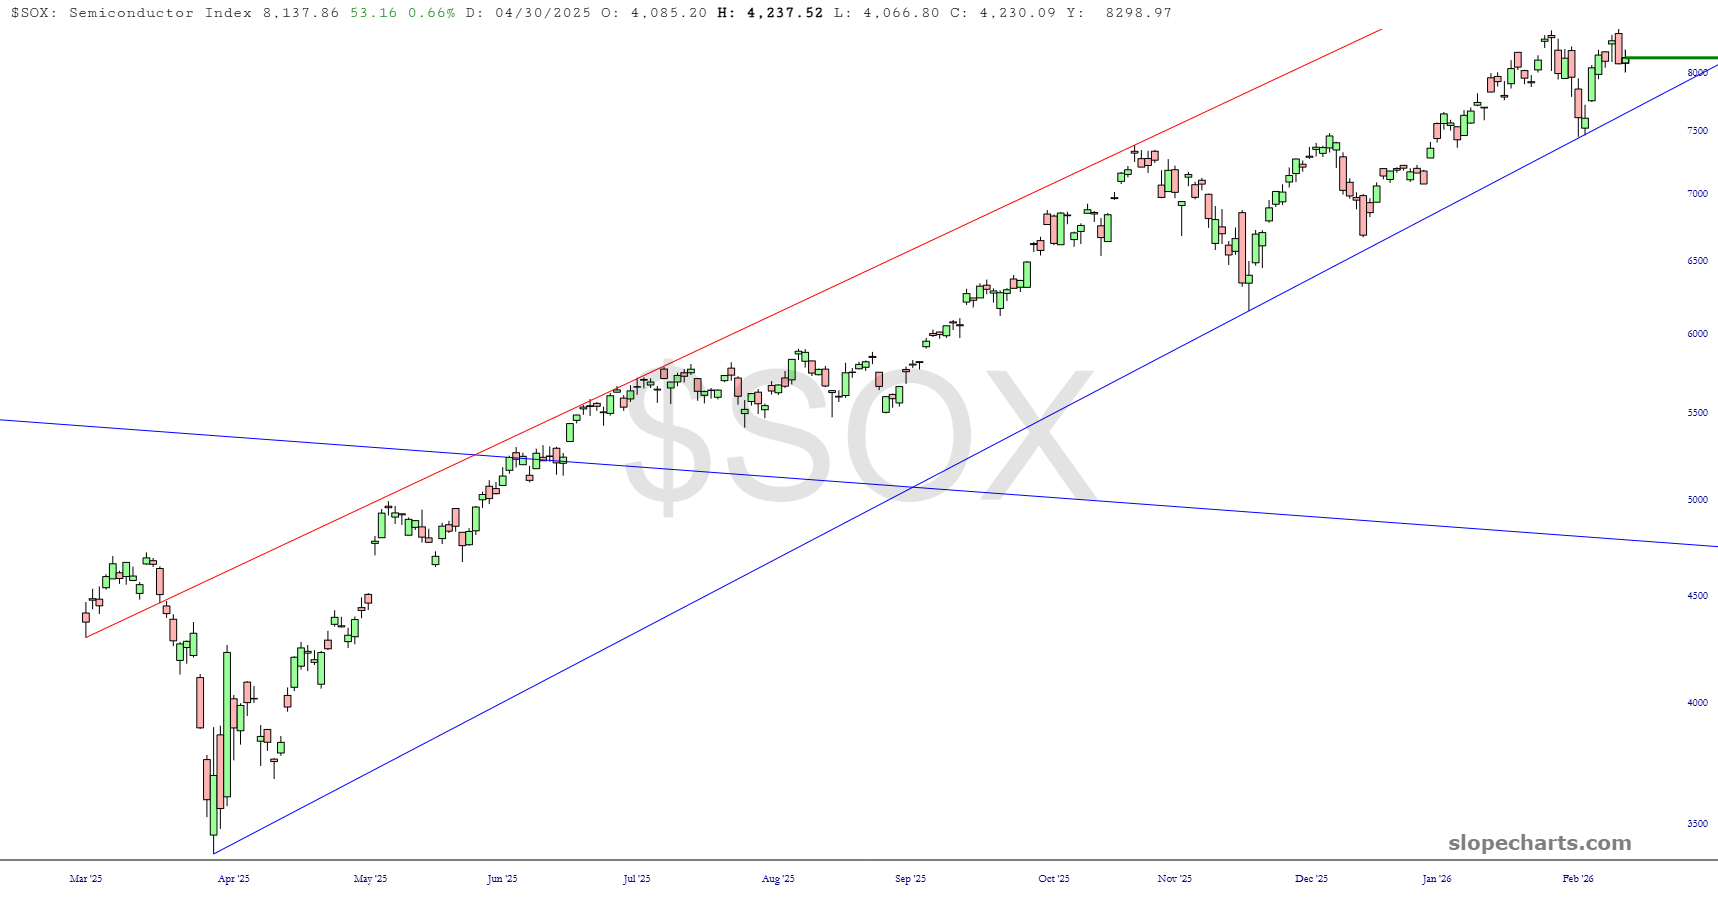
Every word just state about the small caps can be repeated here for the semiconductor index.