
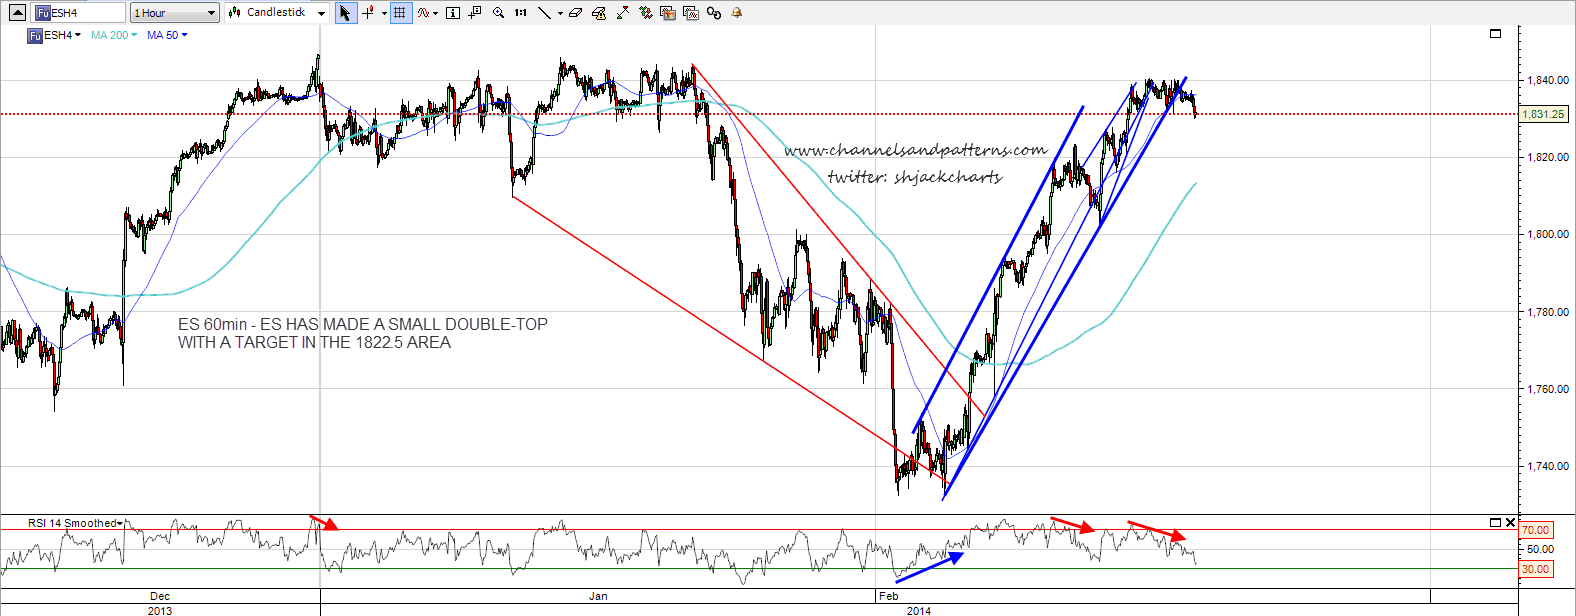
ES closed green again yesterday, delivering a second run of ten consecutive green candle closes since 2000. Looking at the overnight action I doubt that we will see a third record-equalling eleventh green candle today. At the moment ES is trying to hold 1830 and we might still see a test of the 1851 SPX high if it can hold. If 1830 breaks then the double-top target is in the 1822.50 area. ES 60min chart:
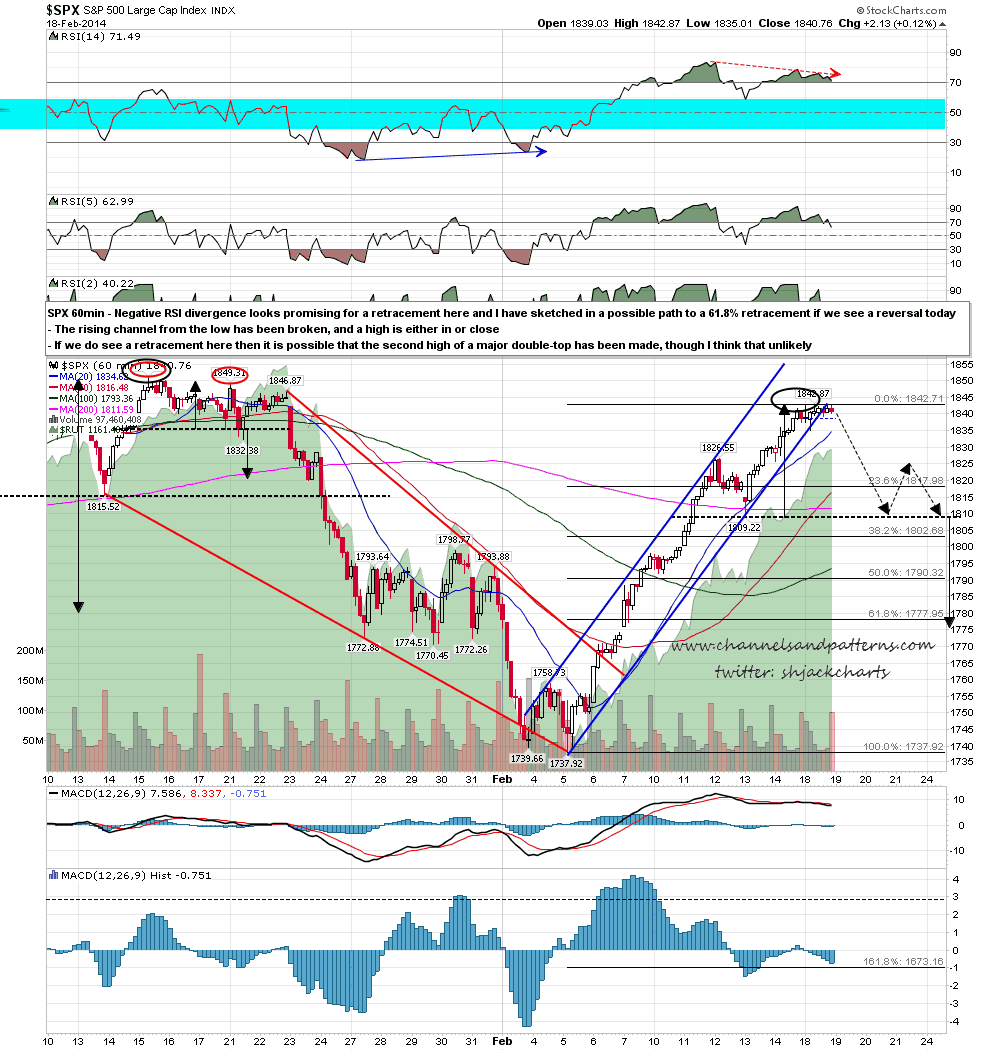
One way or the other the current wave up from the low is topping out. The rising channel from the low on SPX broke yesterday. SPX 60min chart:
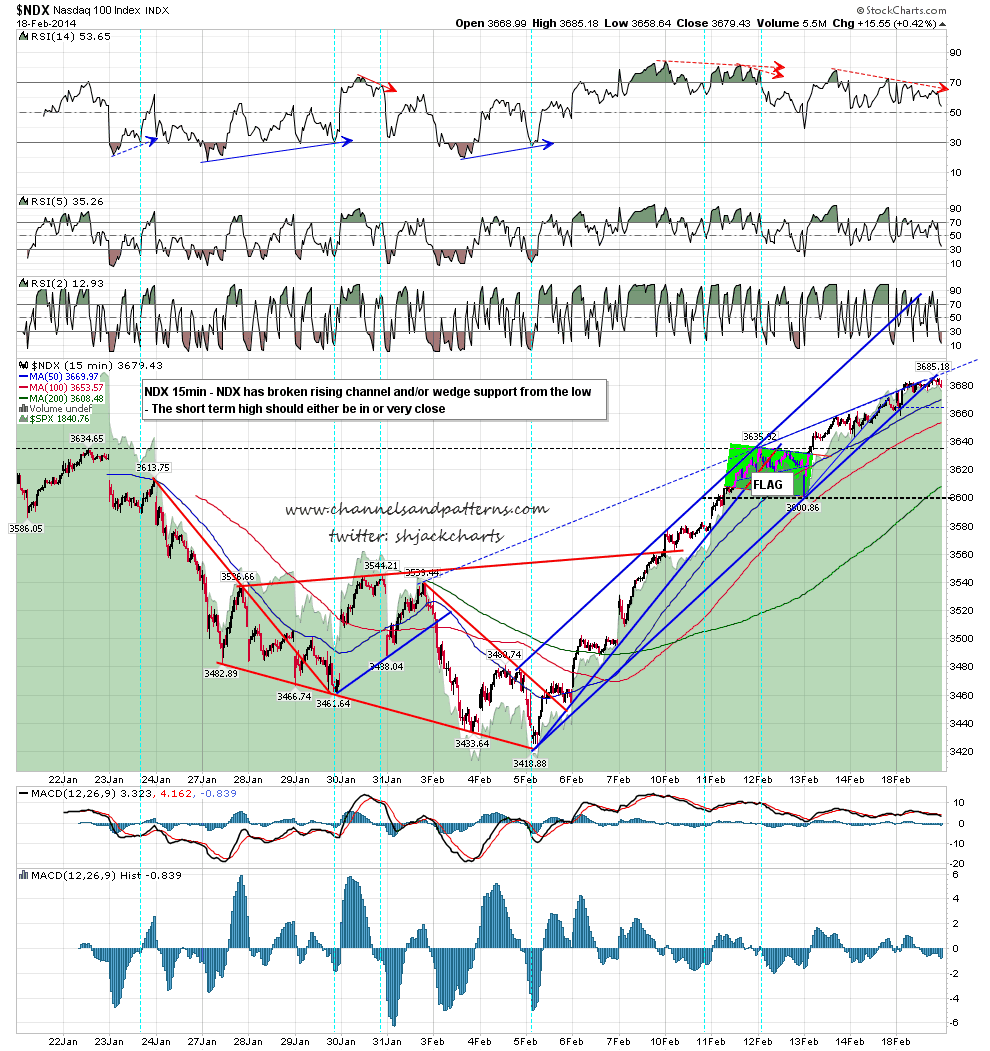
Rising channel cum wedge support on NDX also broke yesterday. NDX 15min chart:
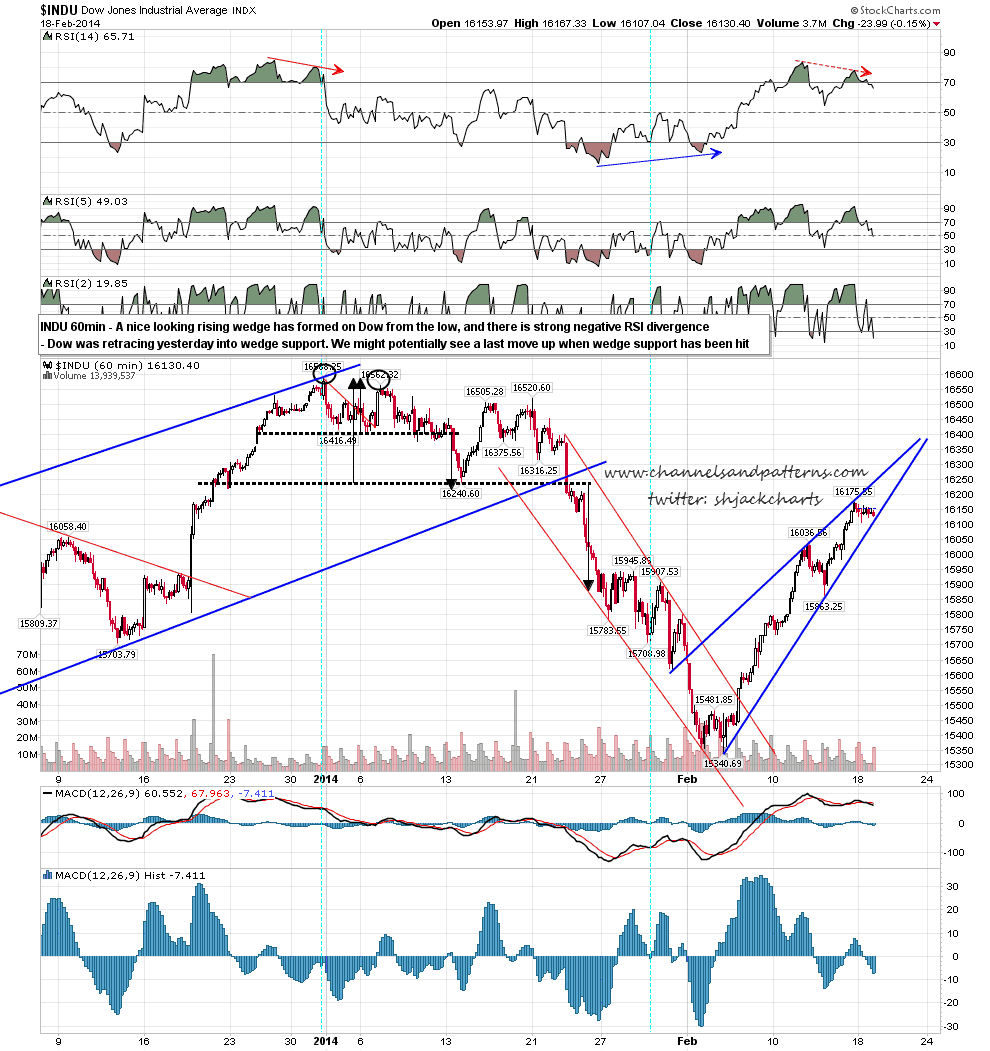
What hasn’t yet broken down is the rising wedge on Dow, though unless there is a significant recovery into the open that is likely to gap under wedge support then. Dow 60min chart:
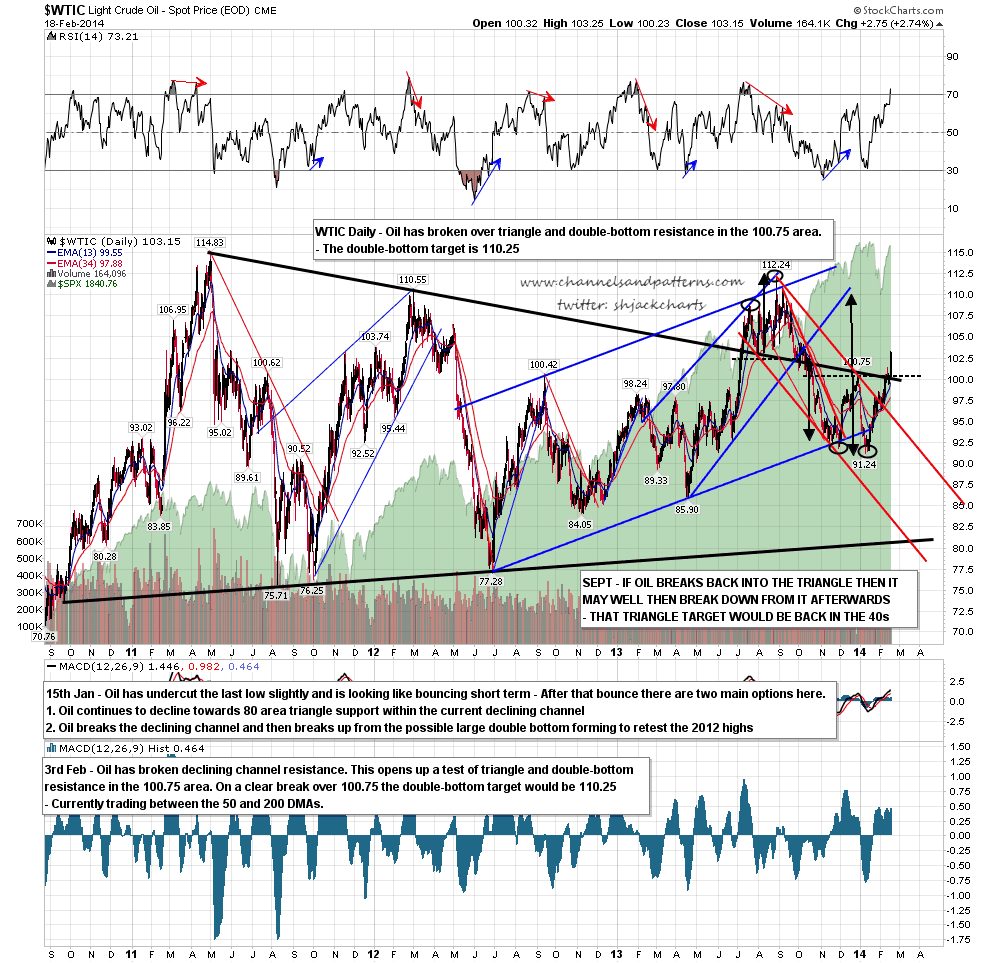
On other markets oil broke up hard through double-bottom resistance yesterday and the double-bottom target is in the 110.25 area. WTIC daily chart:
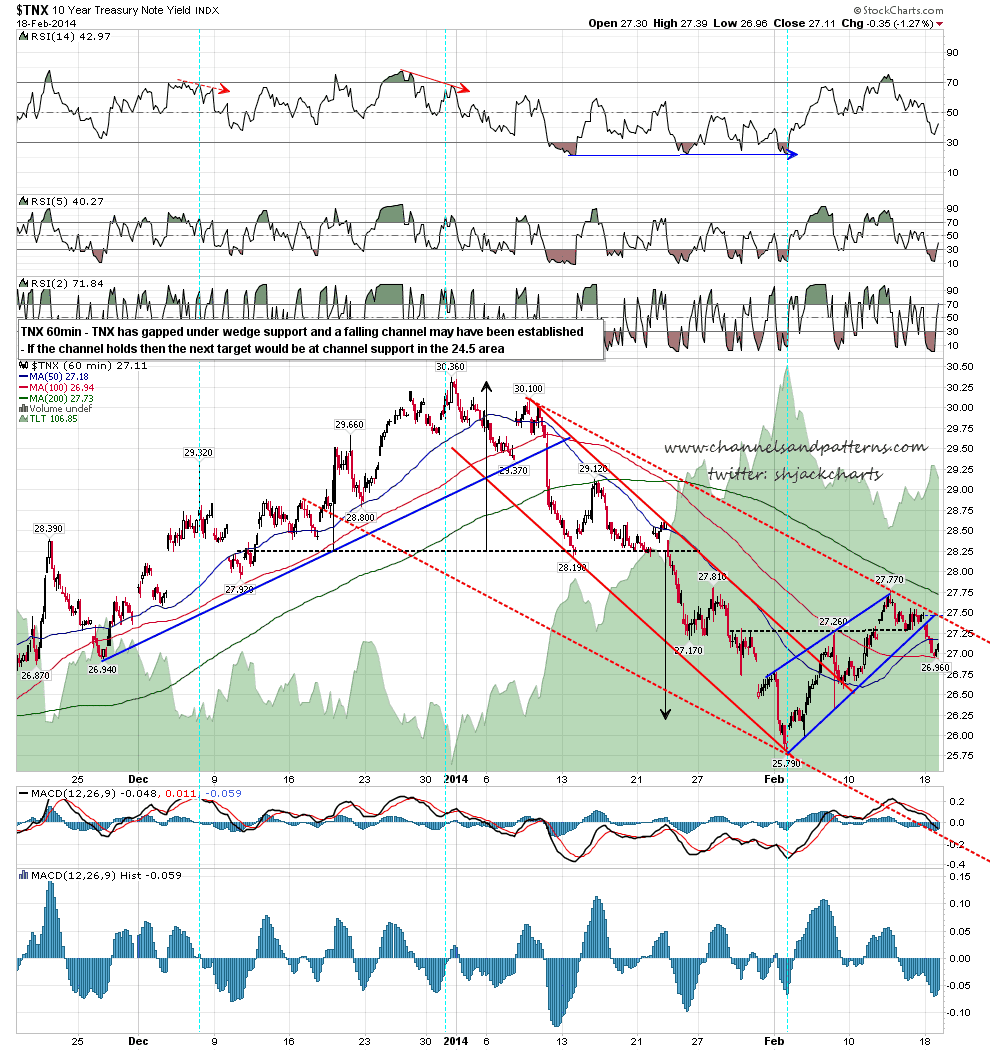
TNX has broken below rising support from the low, and the IHS is in serious doubt. A possible falling channel has formed and on any serious further weakness the falling channel support trendline would be in the 24.5 area. TNX 60min chart:
We might see a last move up today to test the 1851 SPX high but we may well have already topped yesterday. If a retracement is starting then I have the key support areas at 1815-8 for the 23.6% fib retracement and the retest of the 50 DMA, the possible H&S neckline at 1809, and 1800-3 for the 38.2% fib and the retest of the SPX daily middle bollinger band. If we see SPX break back below 1800 with any conviction then I will start seriously considering the major double-top scenario with a target at 1625 on a sustained break below the last low at 1737.
