In our permabull, new-highs-every-day market of ours, it is still worth examining the major cash index charts. I have been remarks about each chart in the caption area.
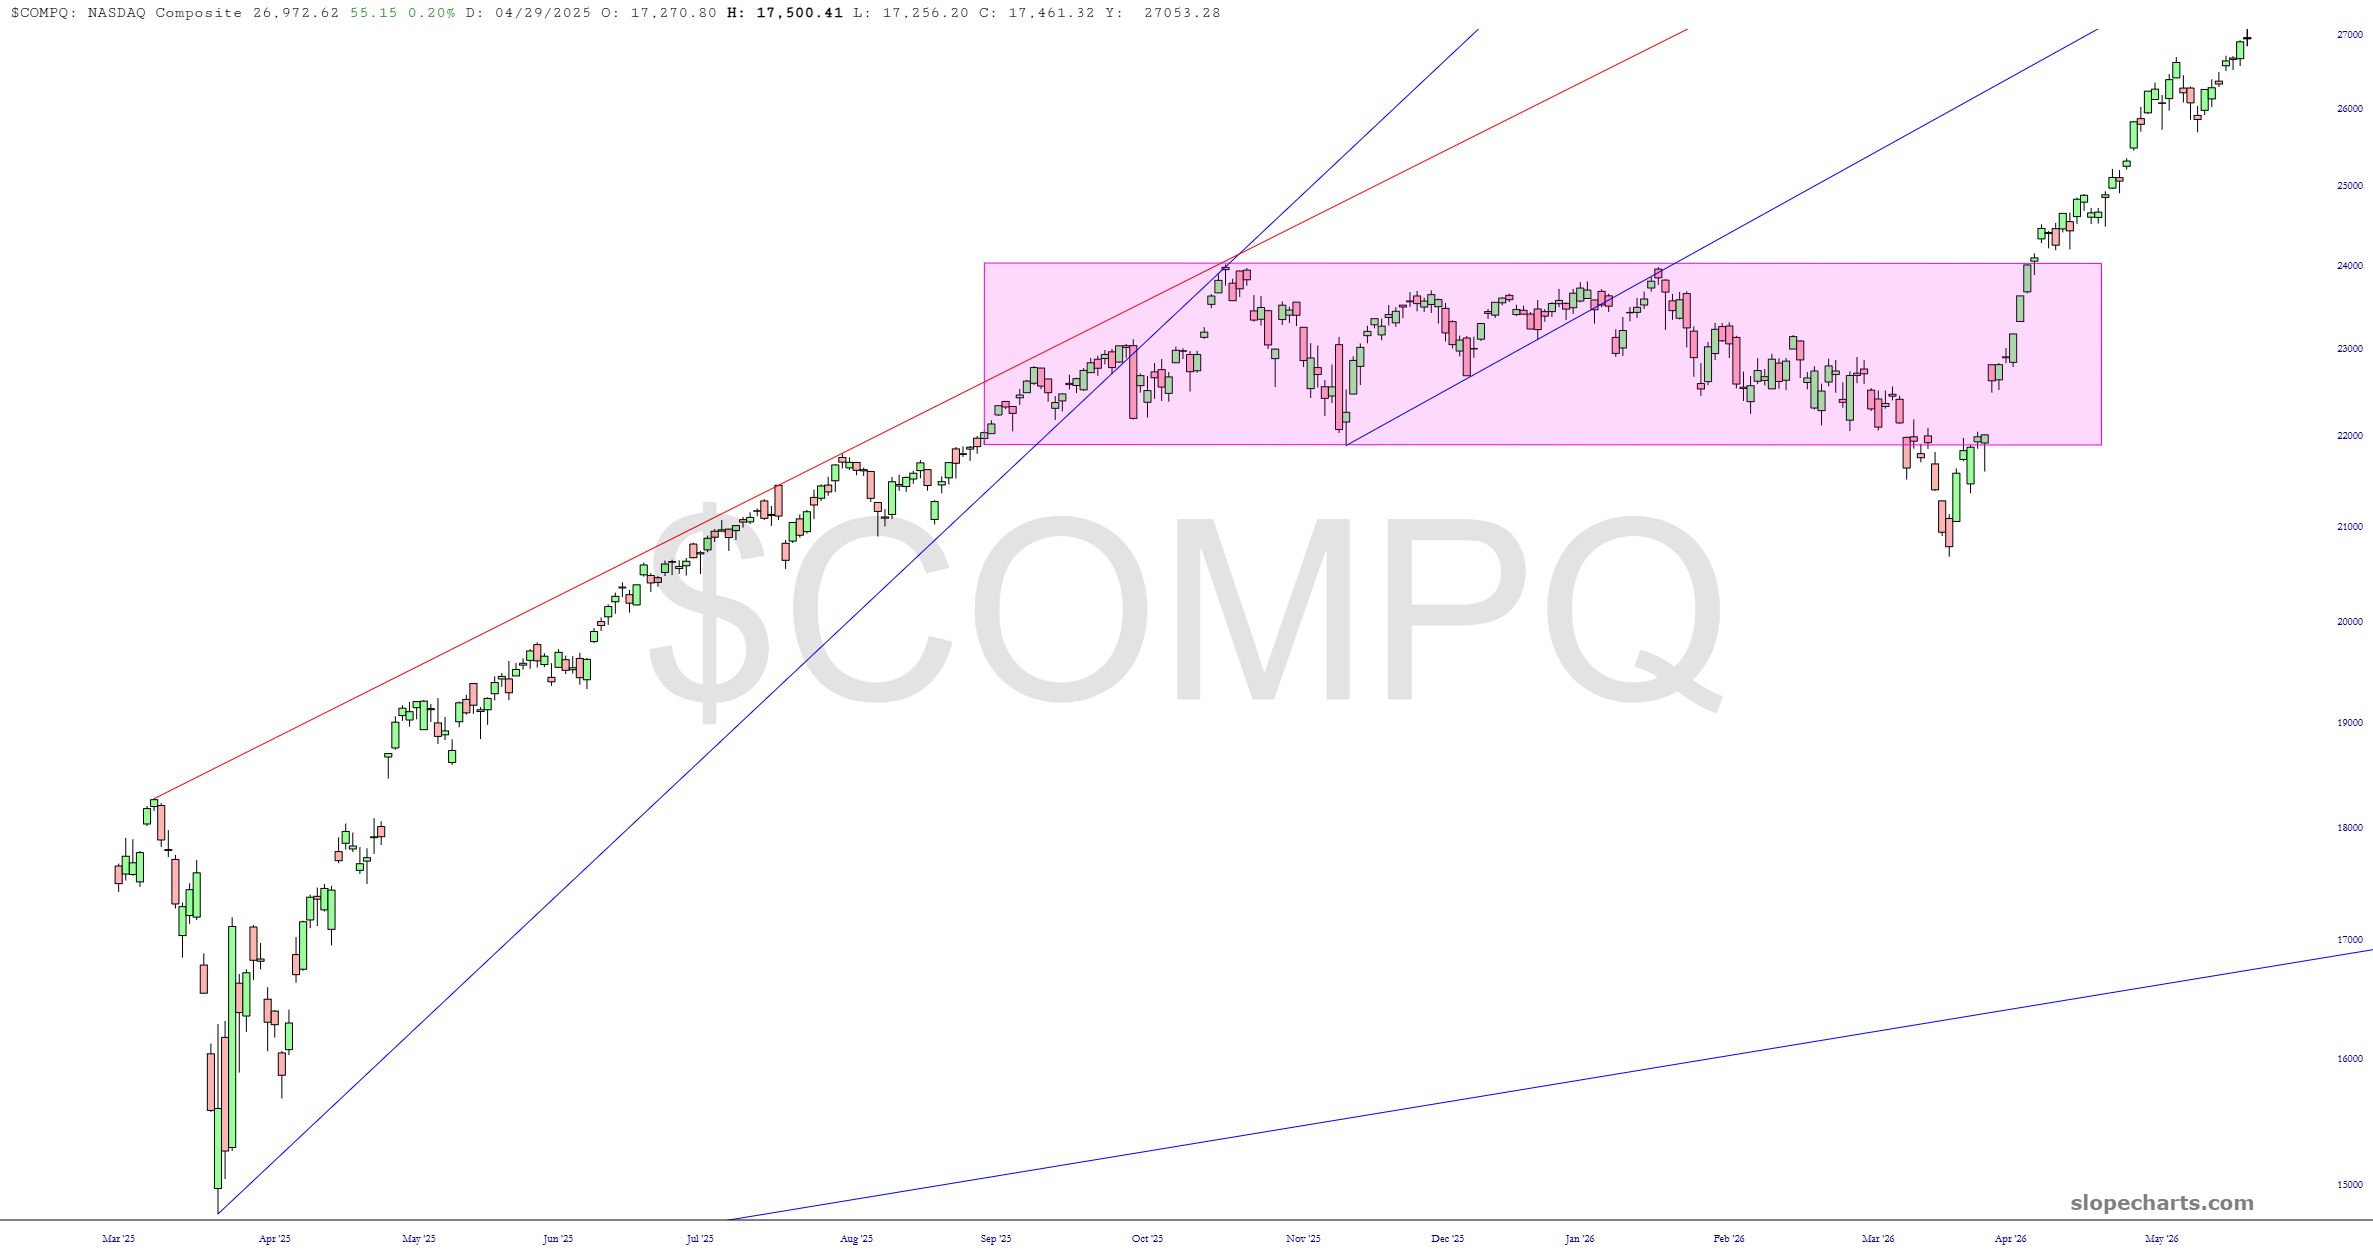
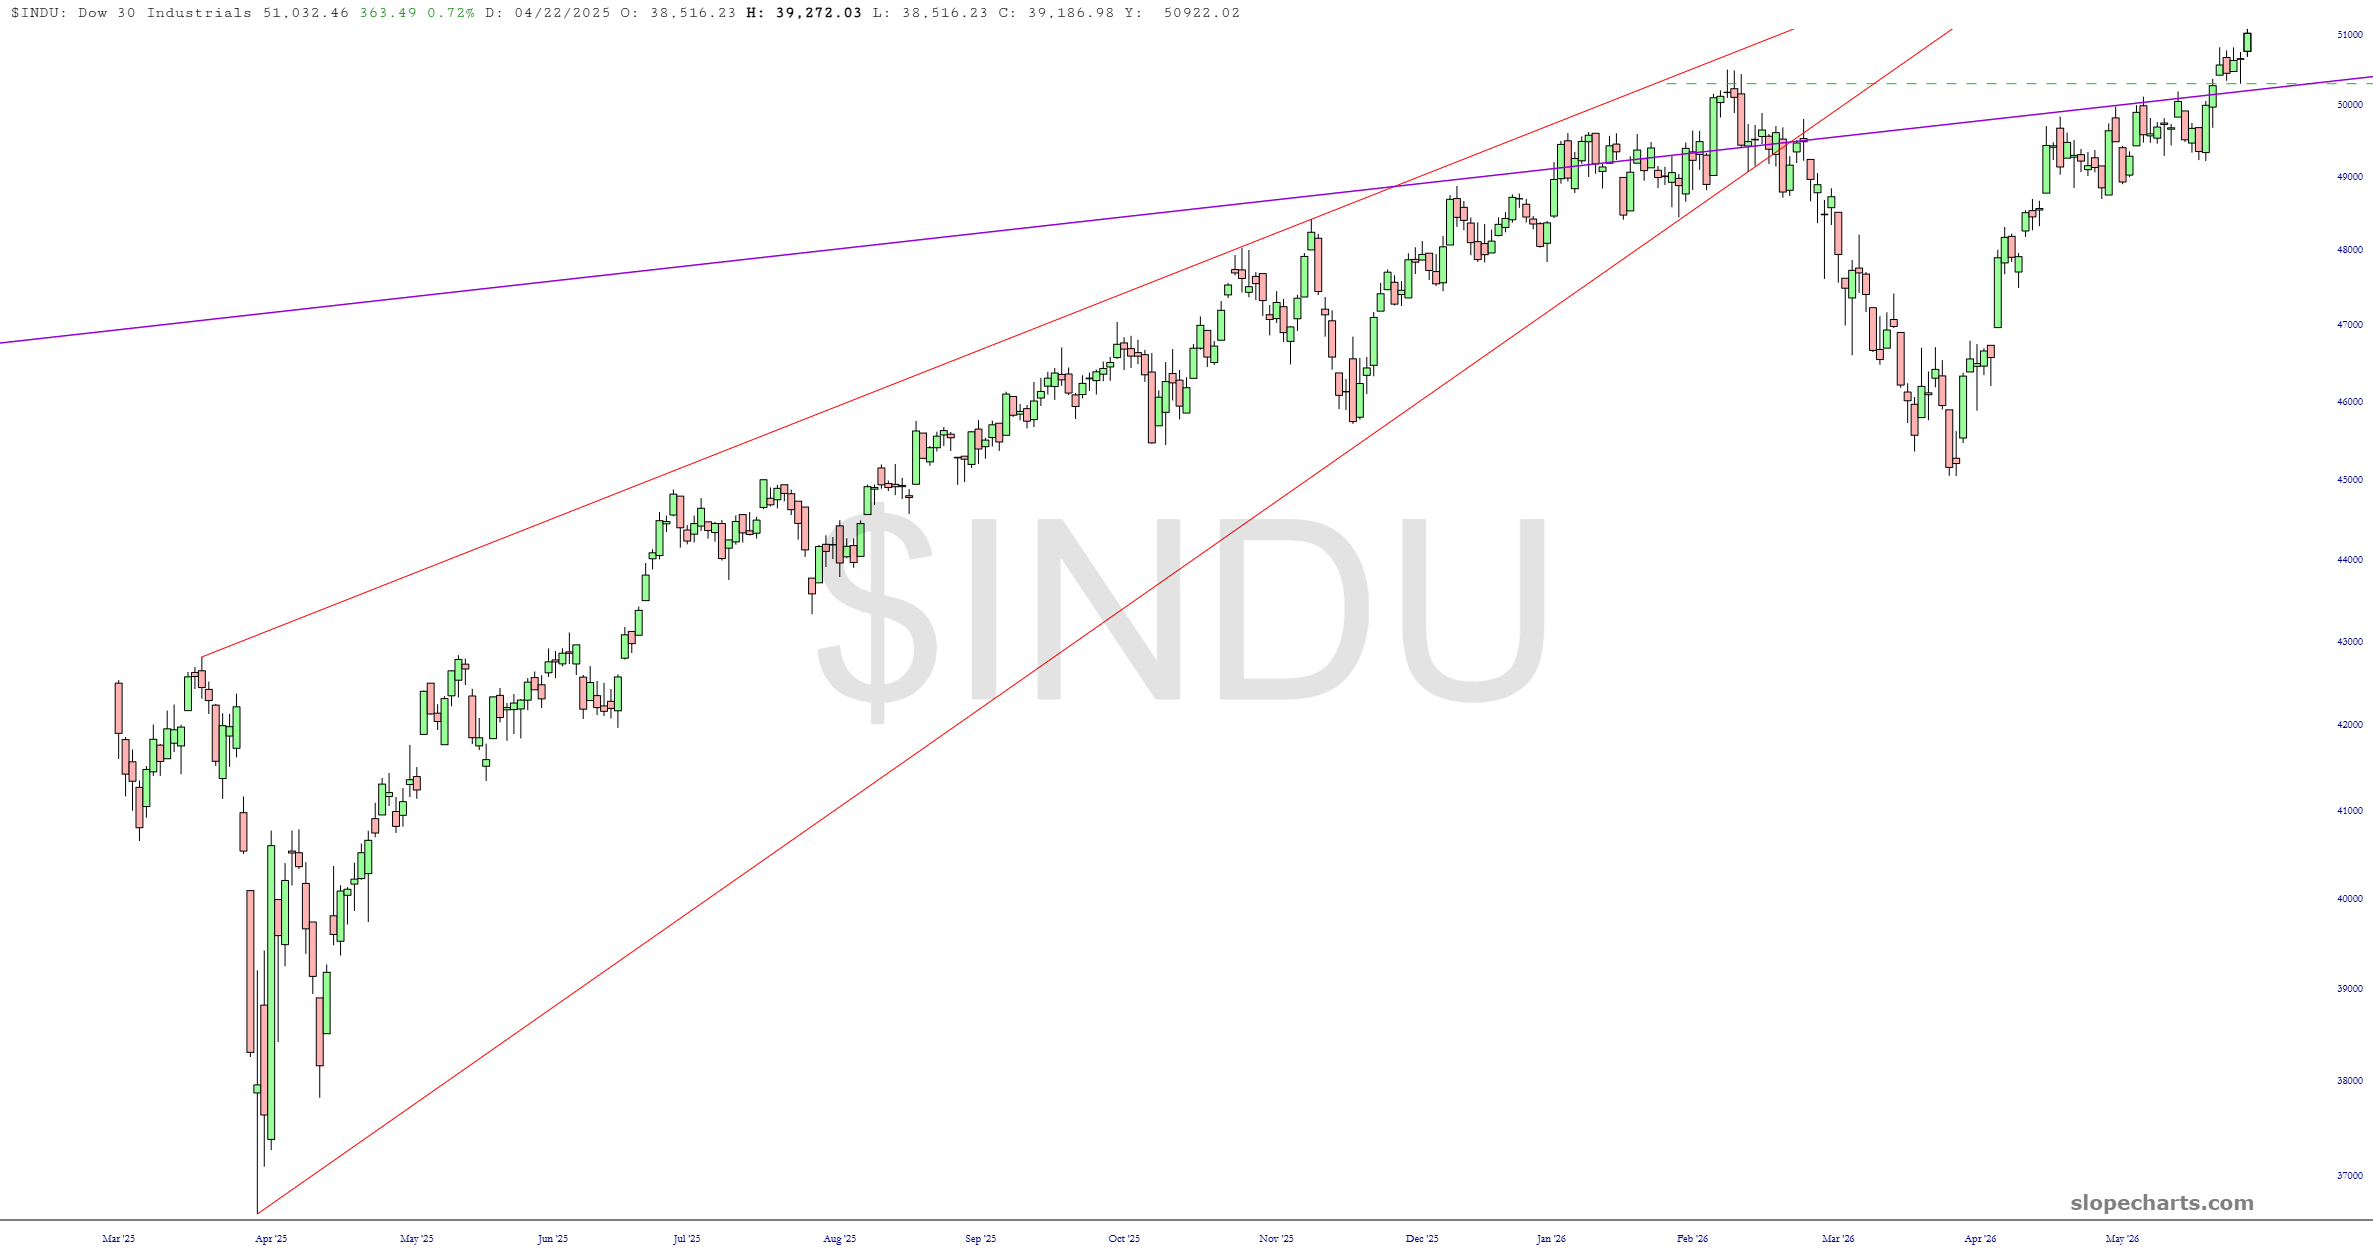
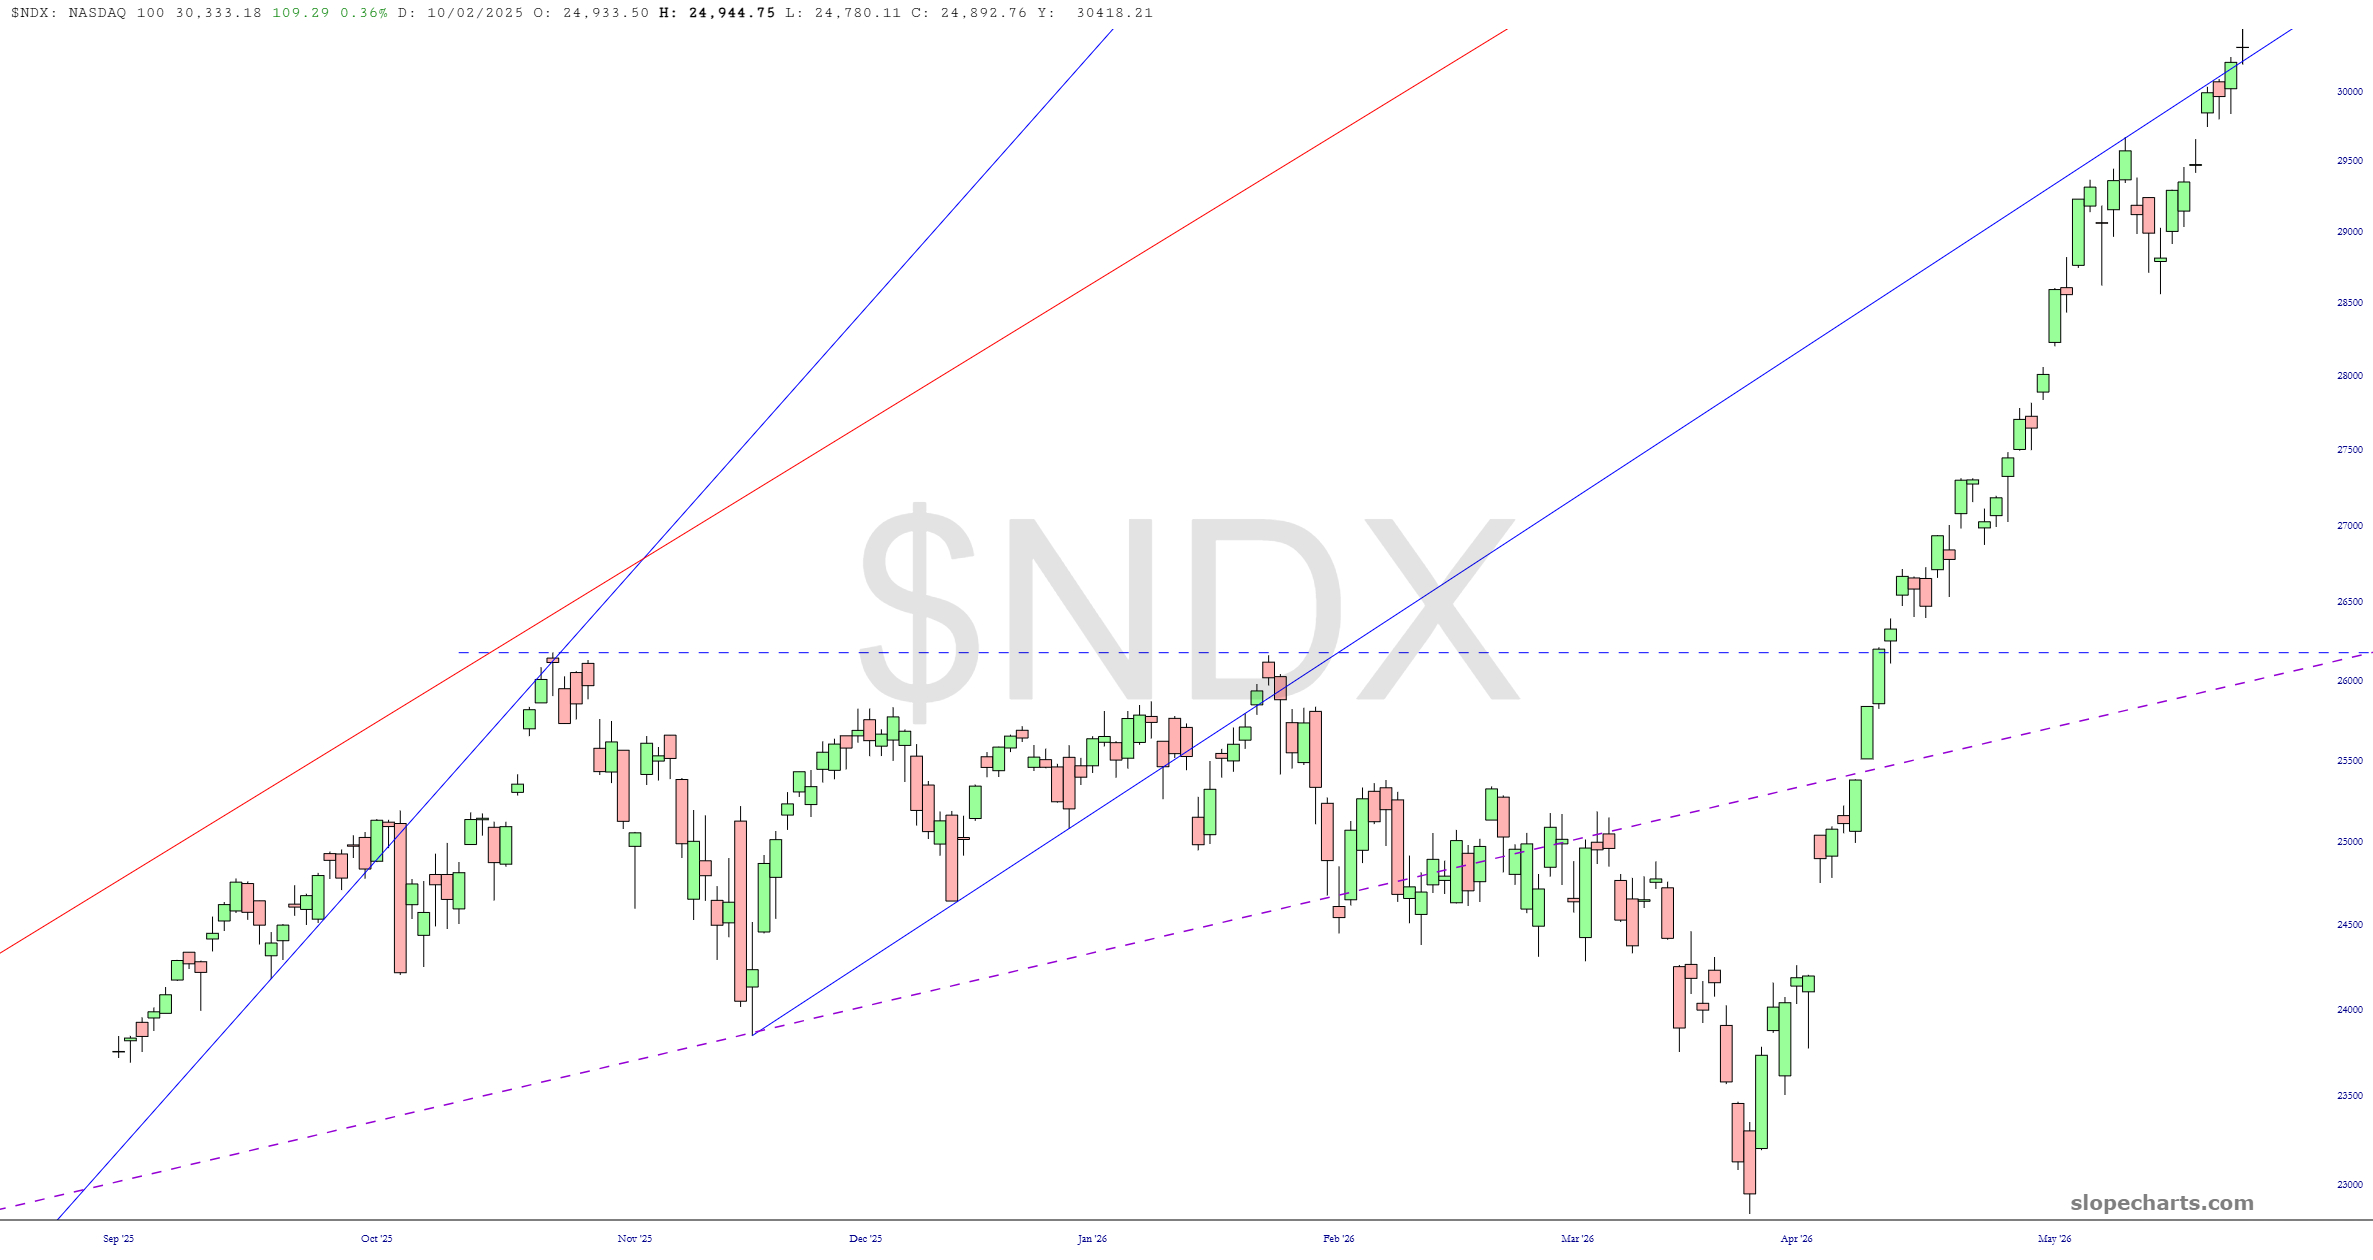
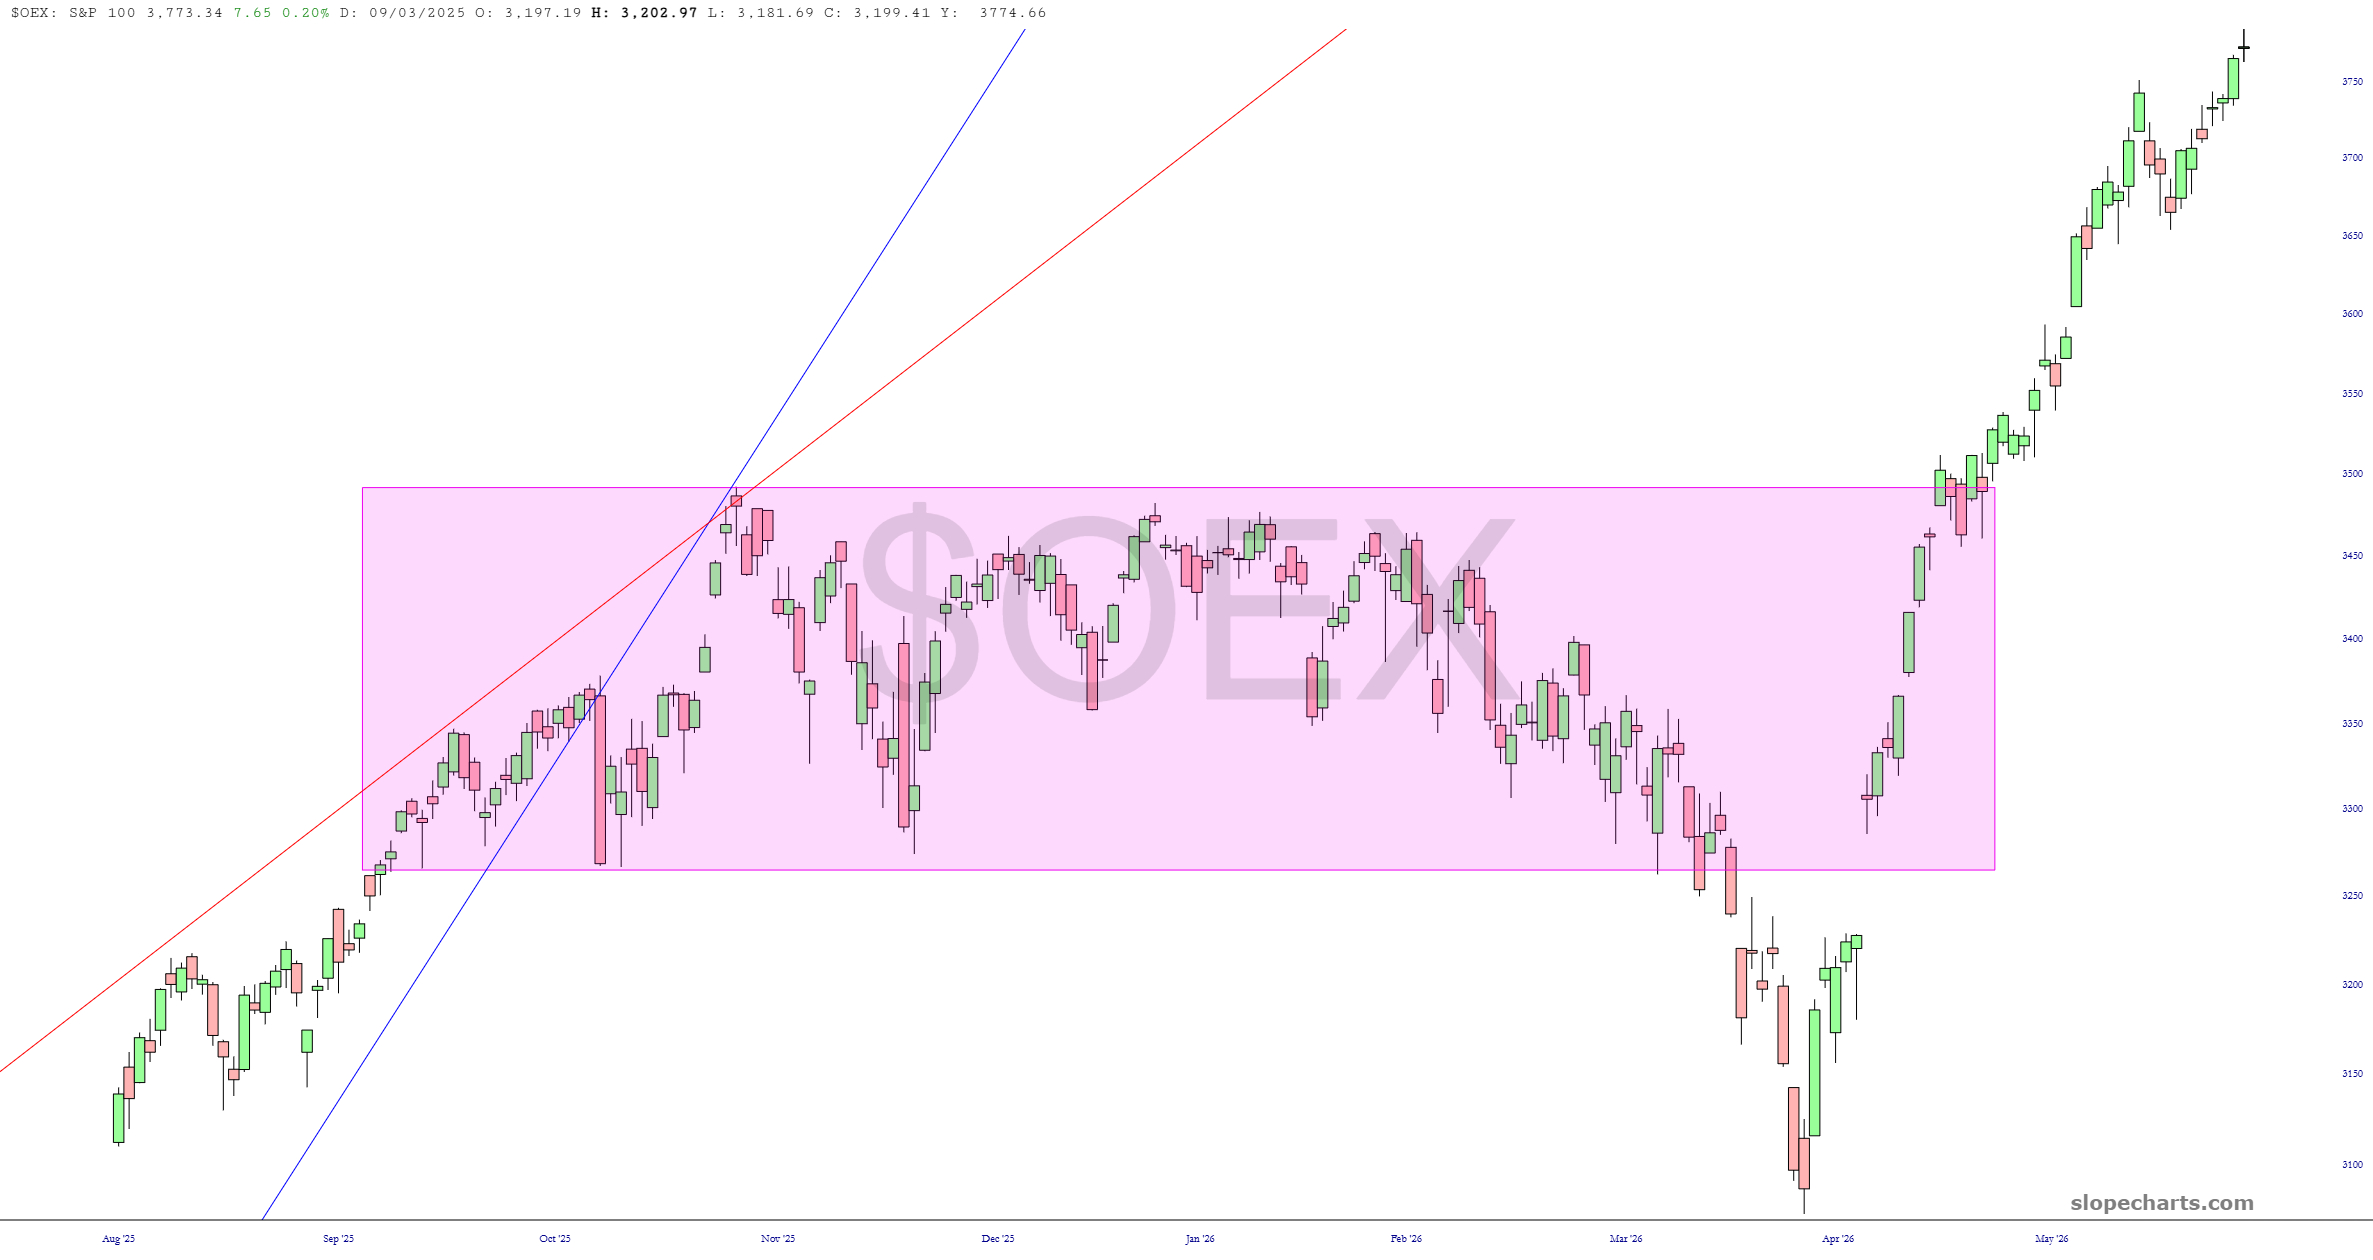
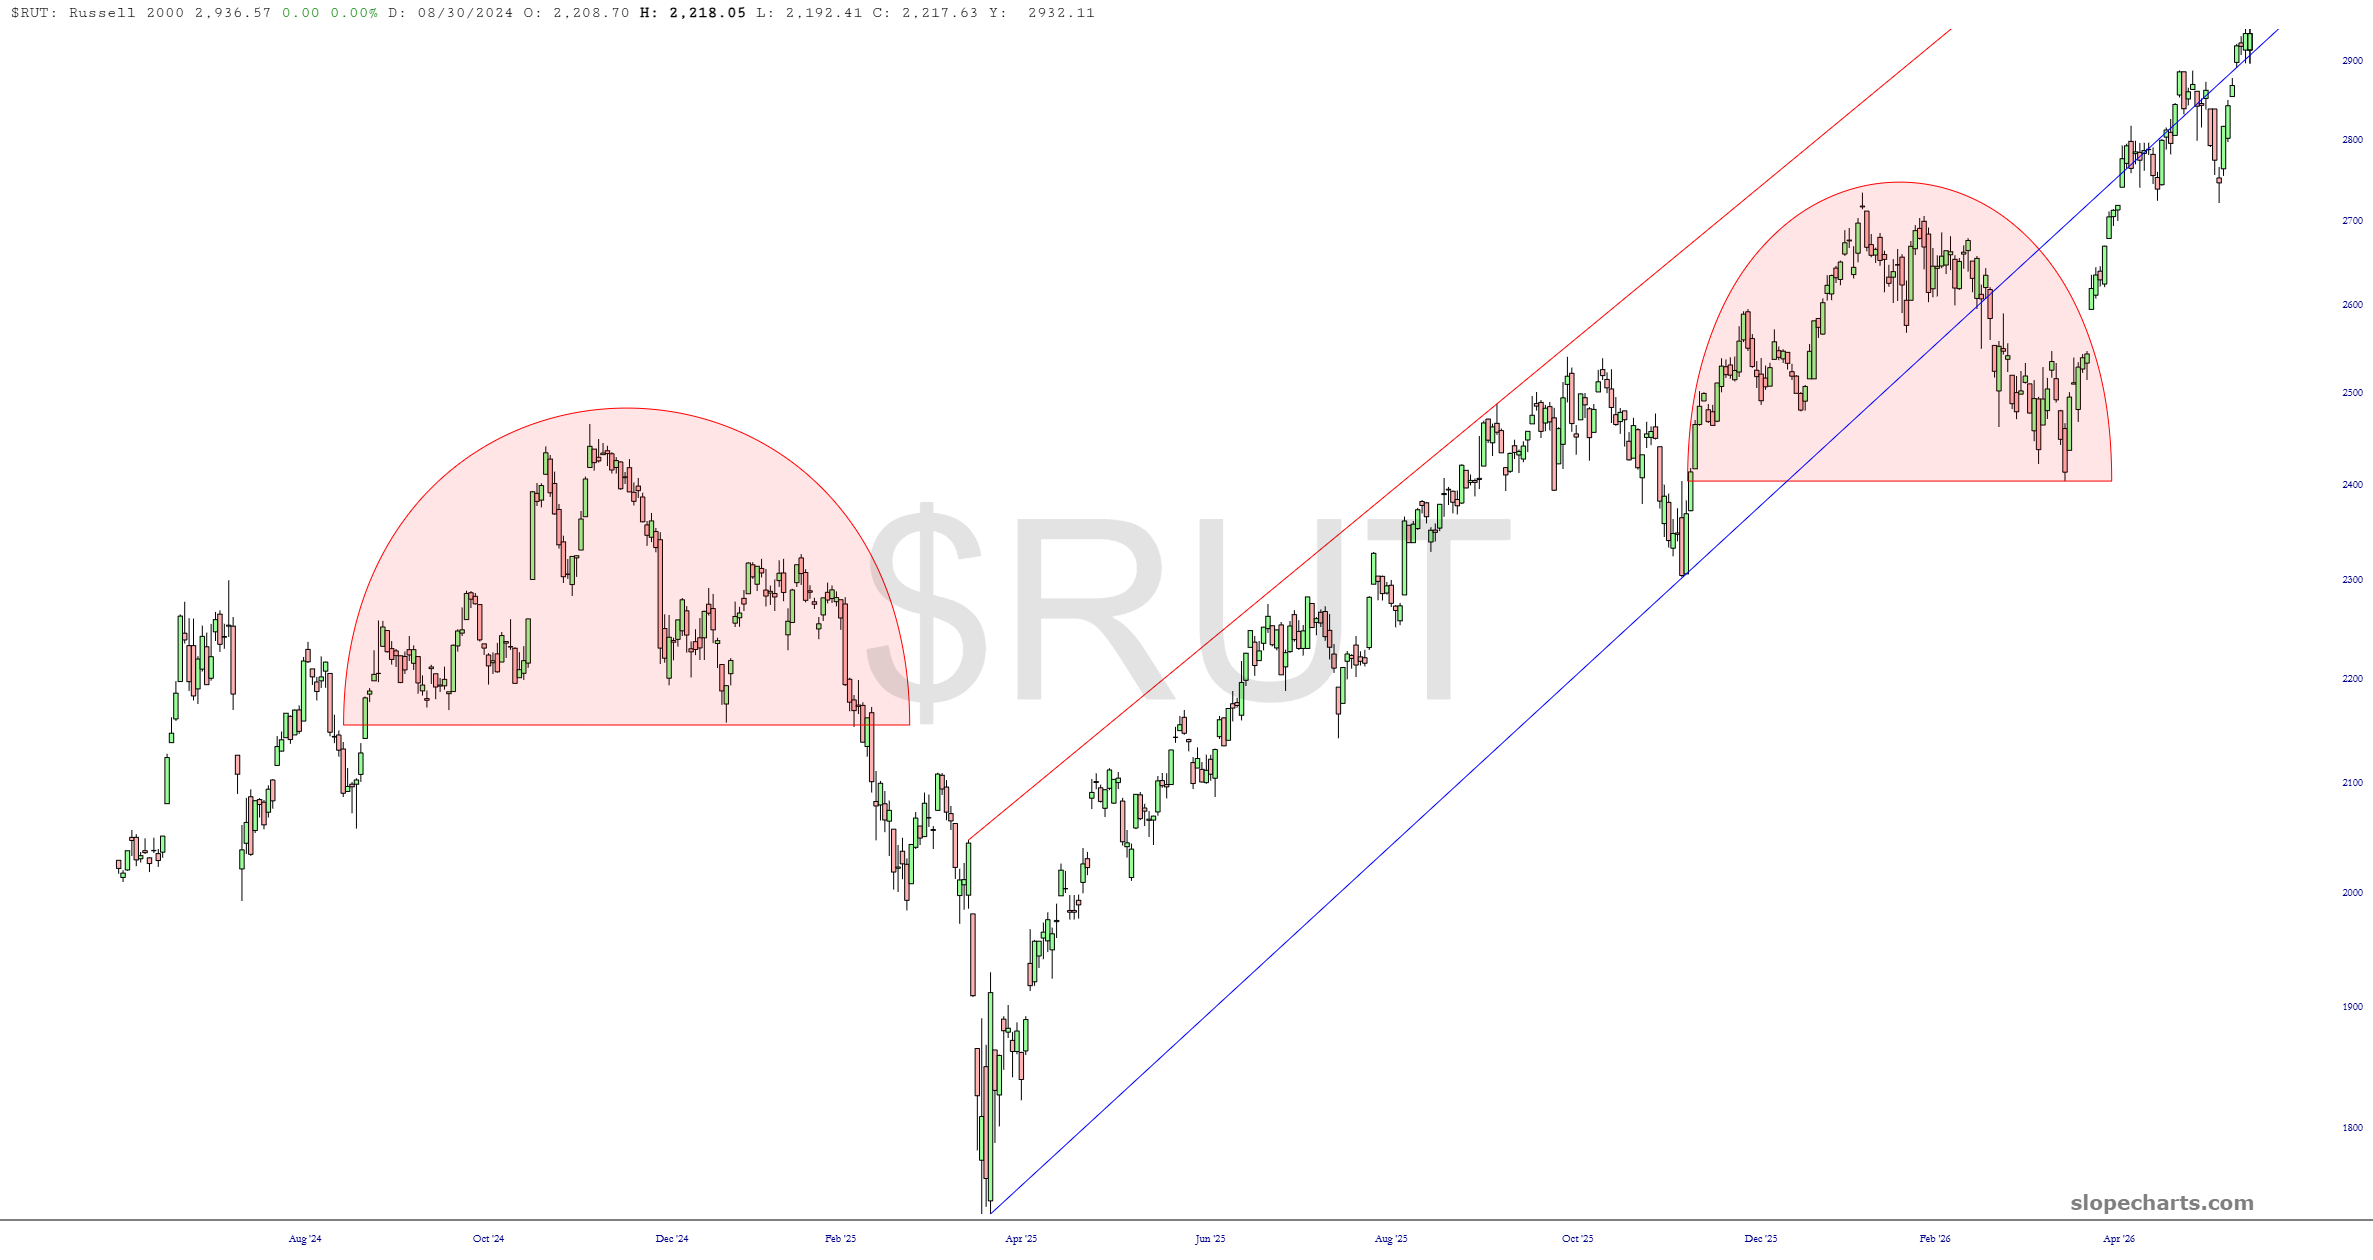
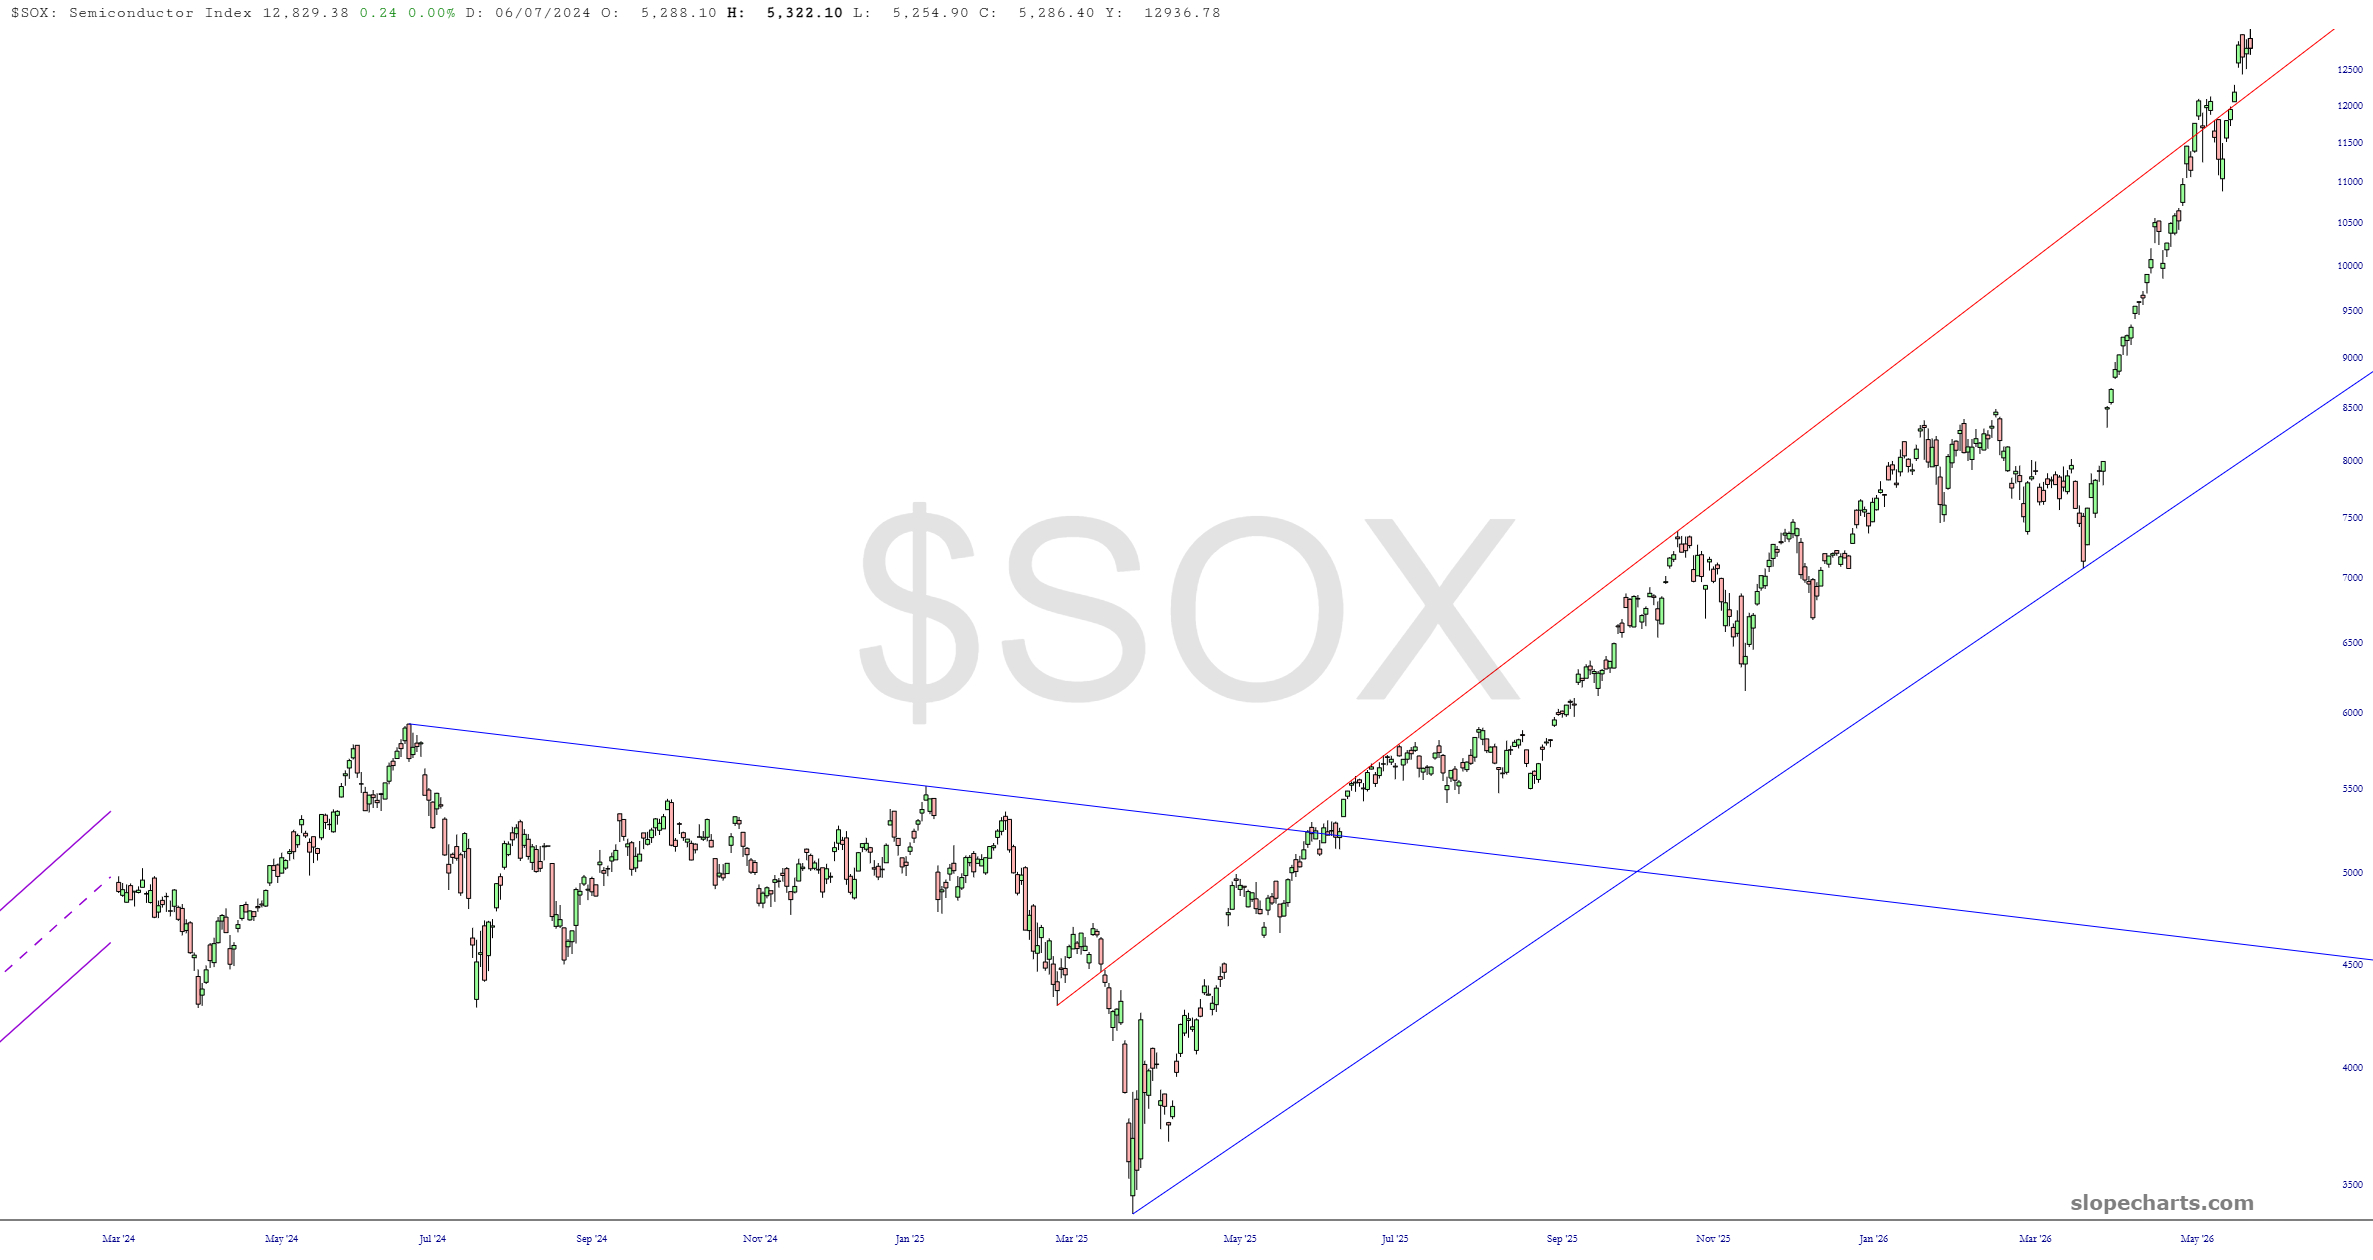
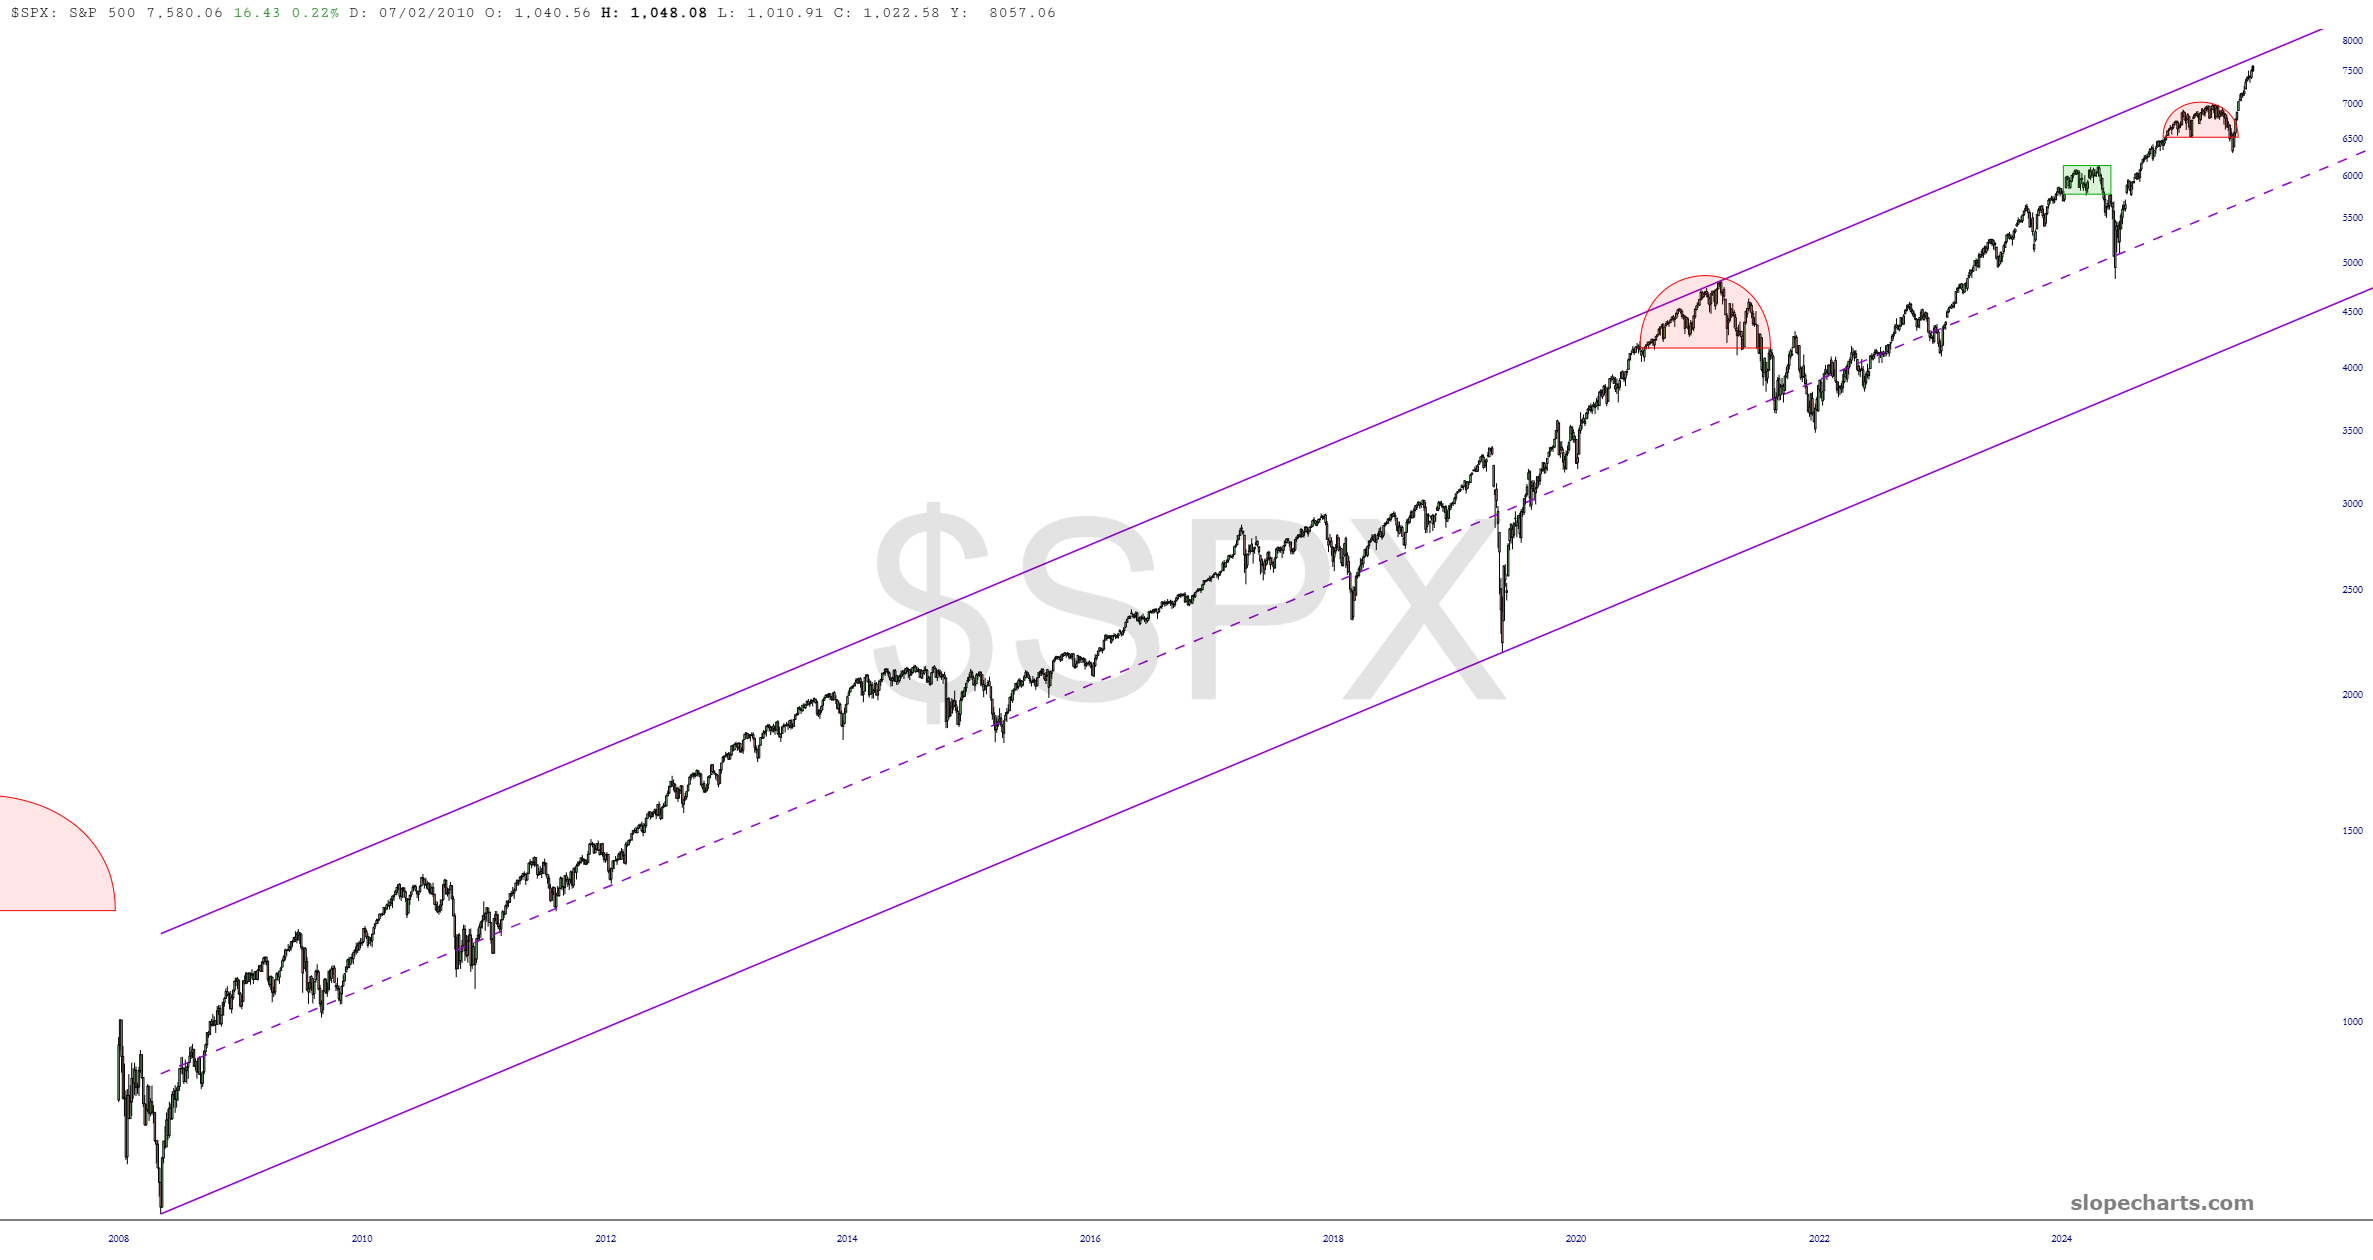
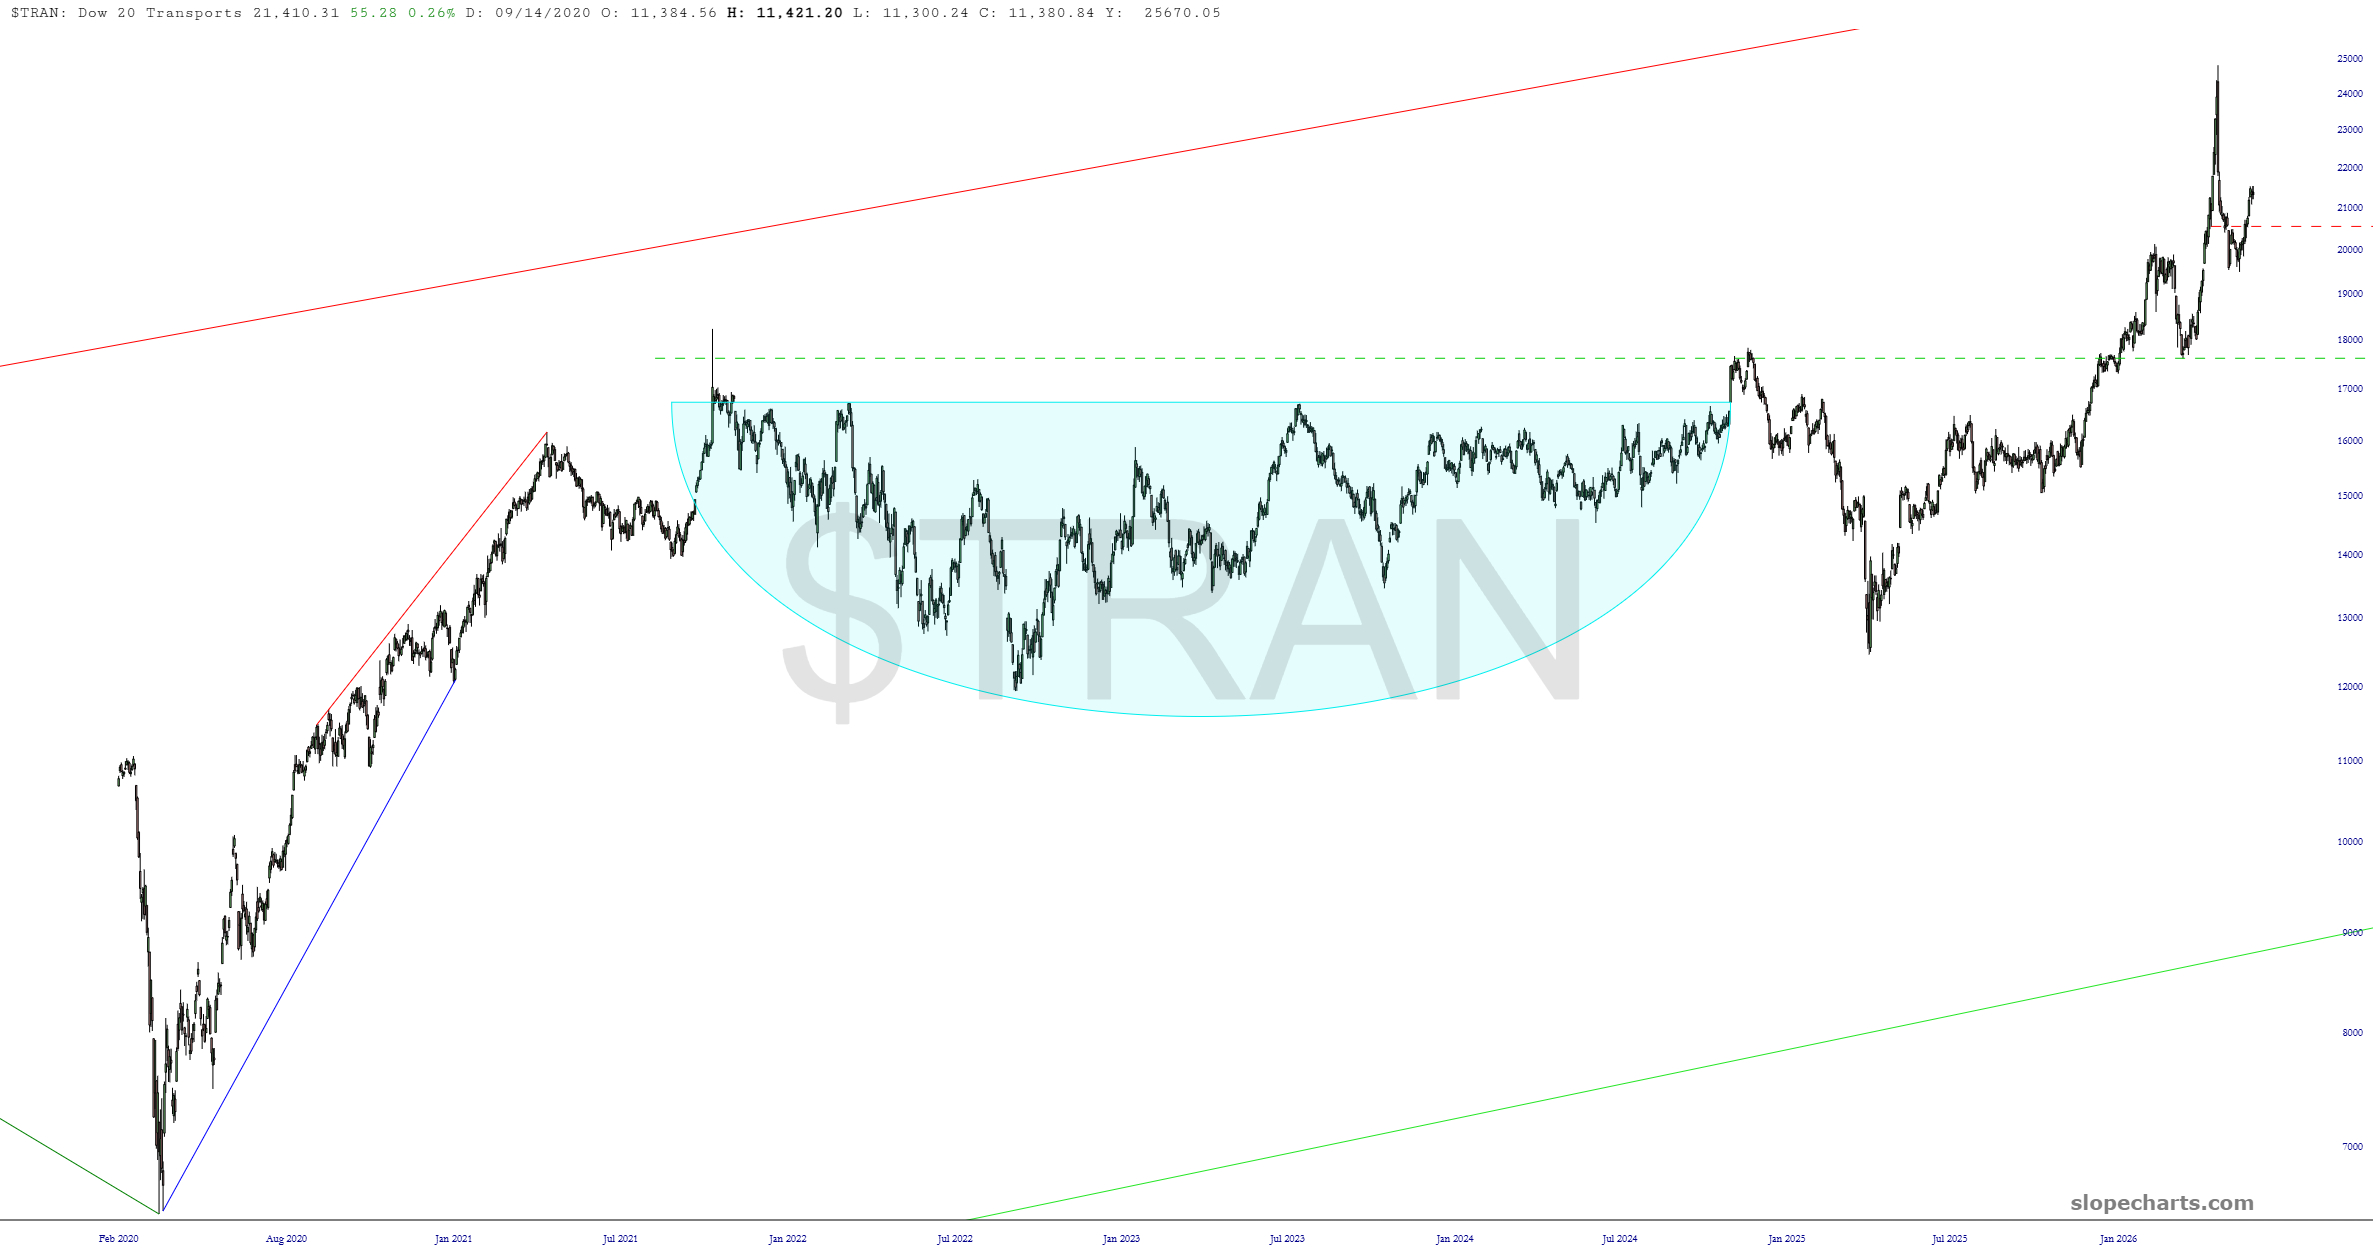
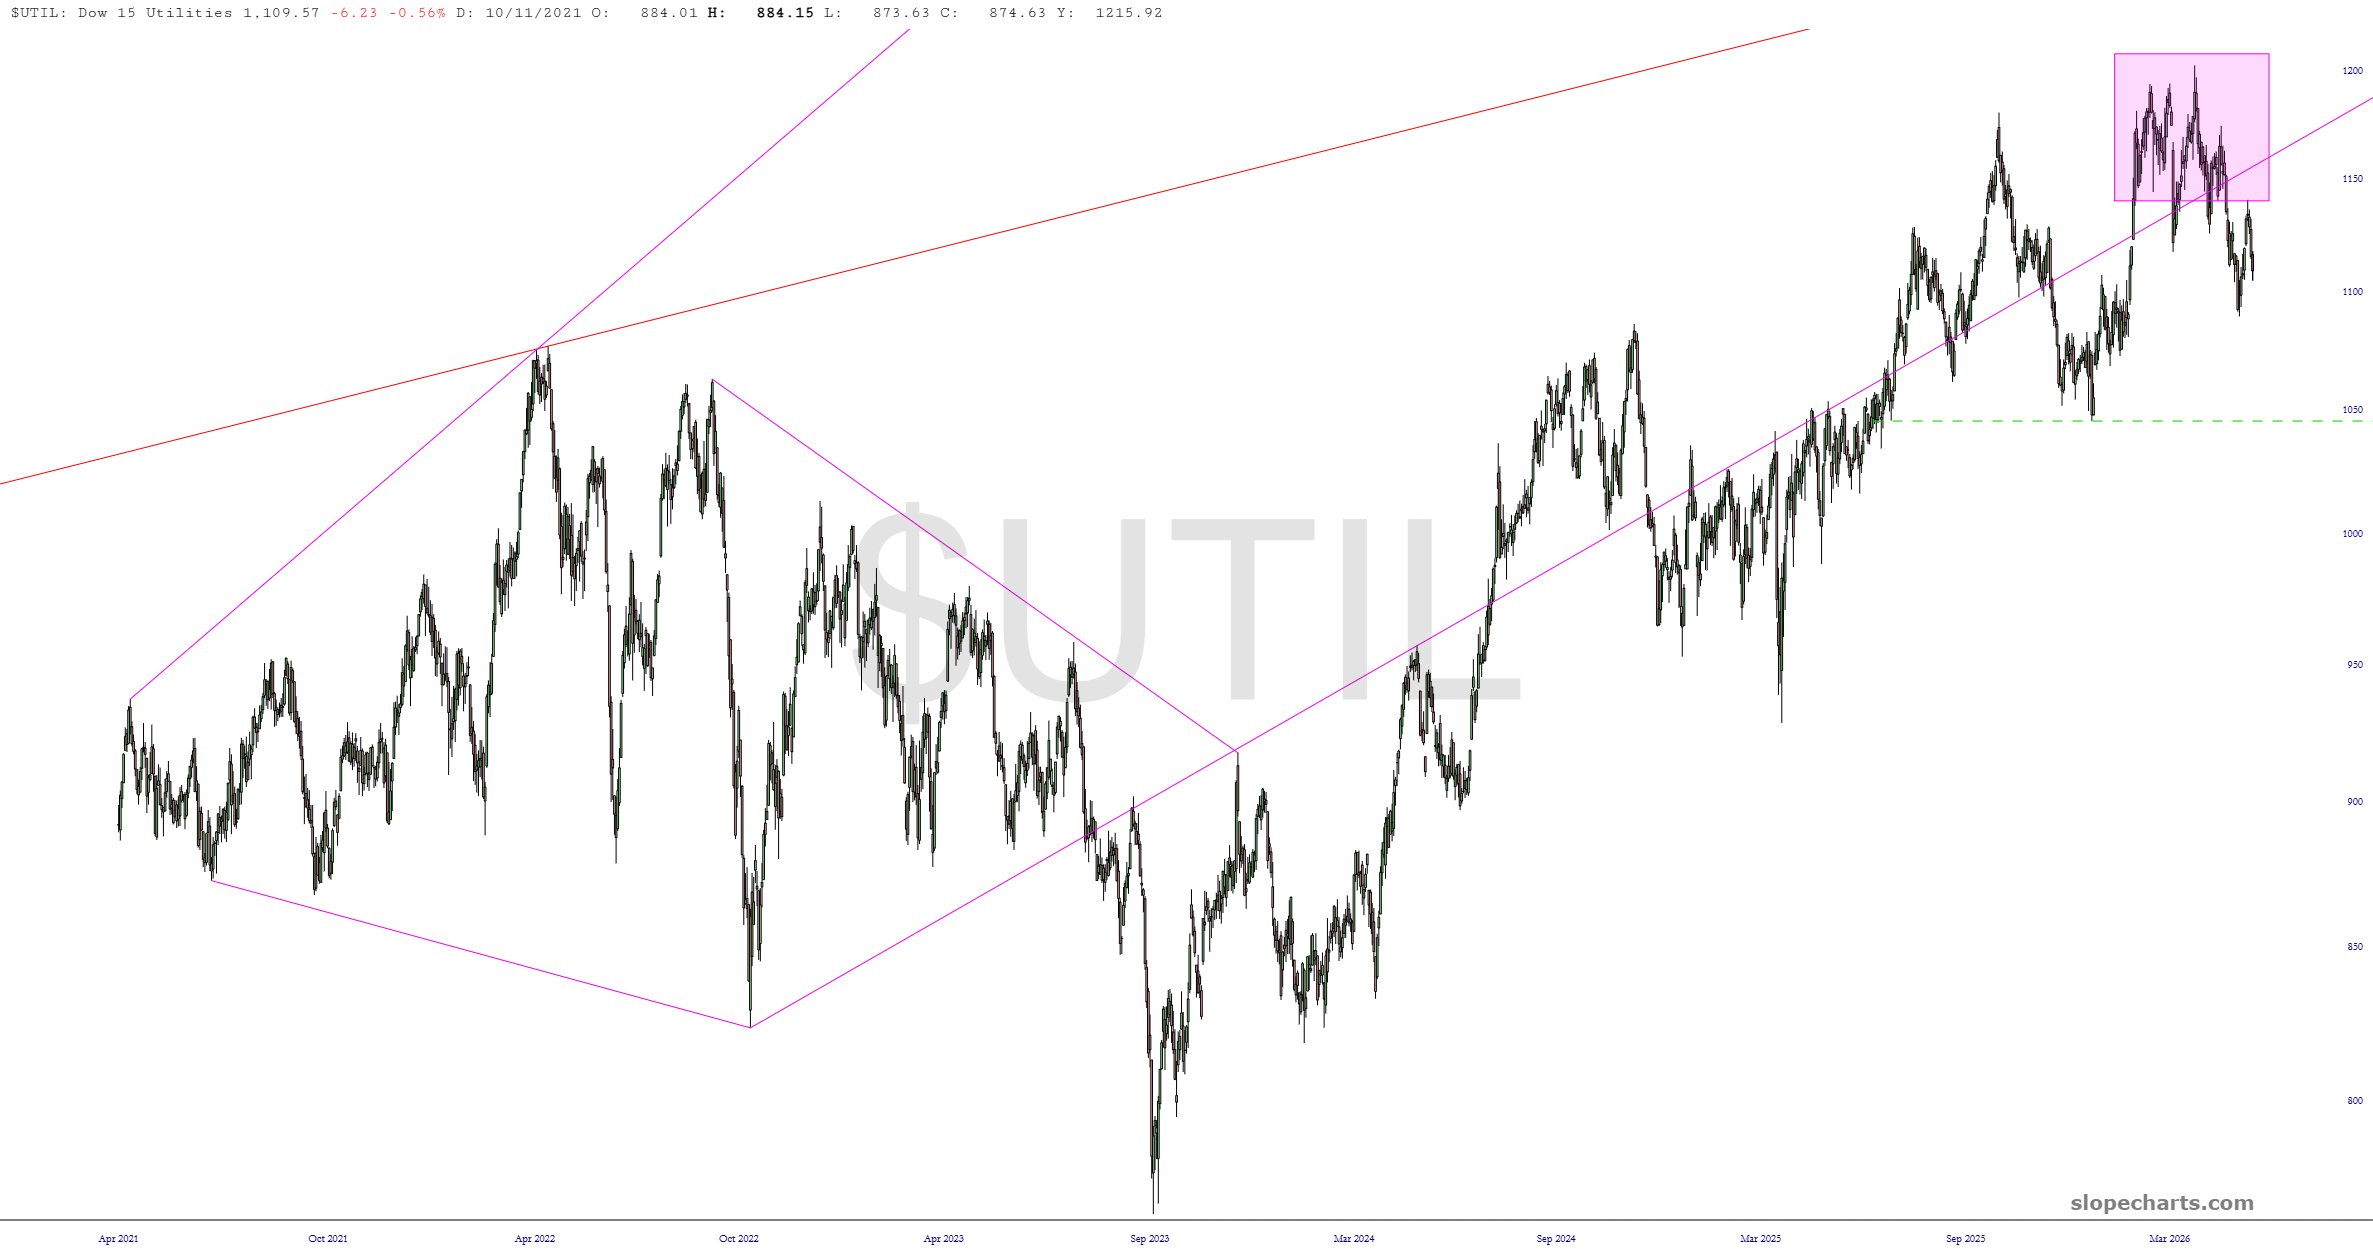
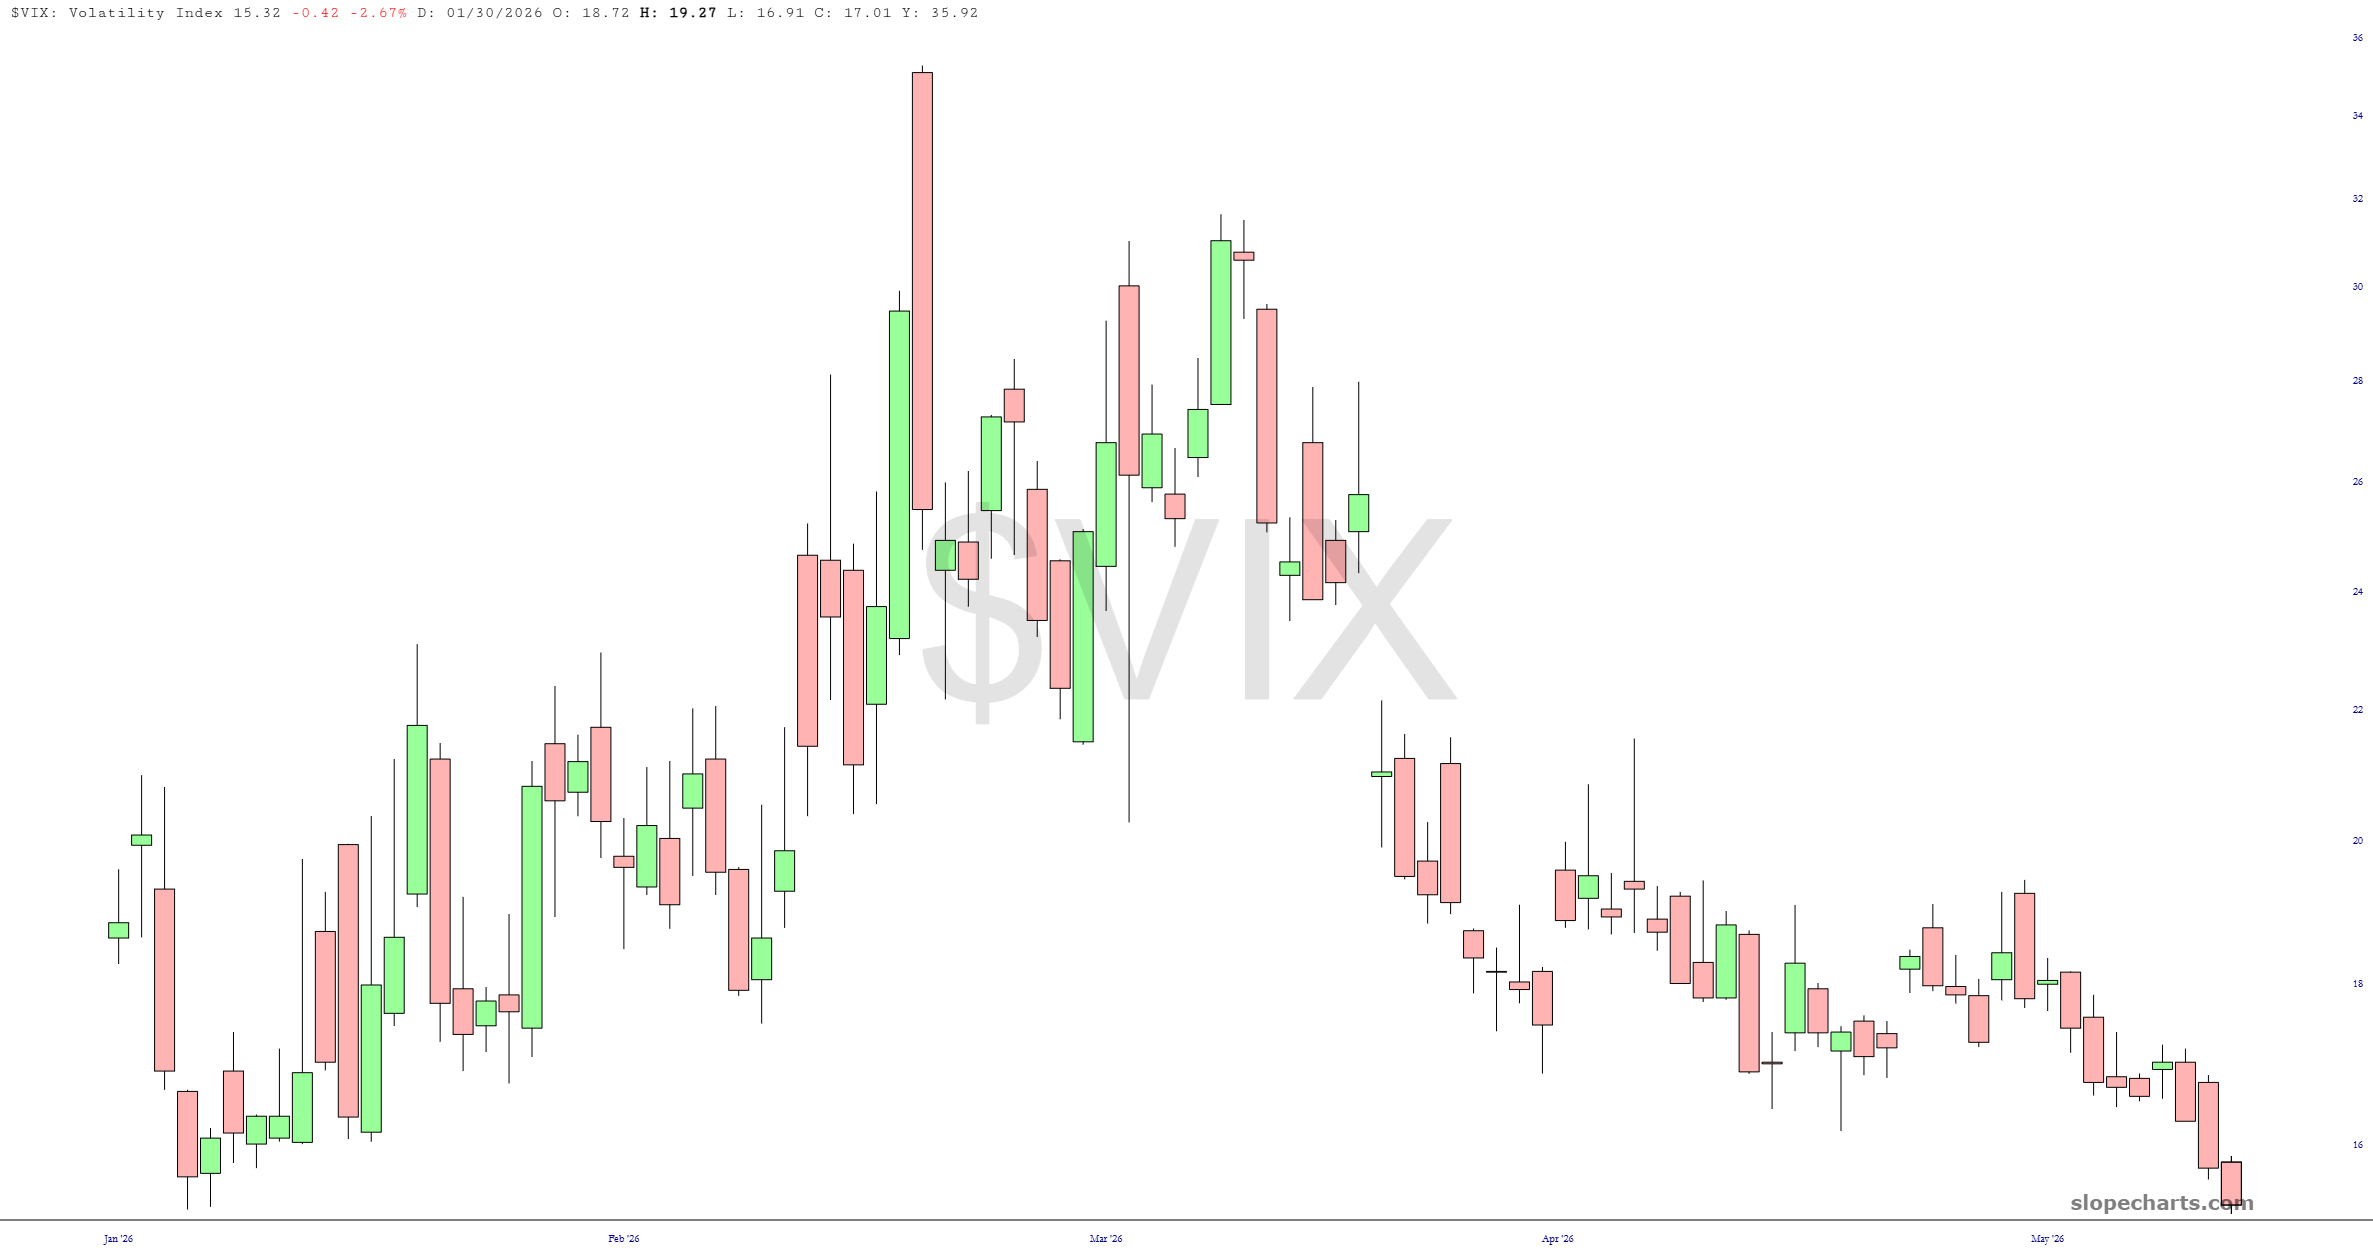
The NASDAQ Composite has lurched to lifetime highs virtually every day. All objective measures show an insanely overvalued market, but it hasn’t mattered one iota yet.The Dow Industrials is not just safely above the psychologically-important 50,000 level, but has even exceeded 51,000.The NASDAQ 100 is similarly situated, although its relationship to the trendline suggests resistance here.It’s impossible to know what, if anything, could create meaningful selling in the S&P 100. One possibility is the mega-IPO SPCX coming public in two weeks.The one interesting aspect of the Russell 2000 is the fact that prices are mashed against a broken, medium-term trendline.The semiconductor index has been so strong that it has exceeded even its sharply-ascending wedge.The S&P 500 price is mashed right up against a multi-decade trendline and suggests very minimal additional upside.One stock, CAR, goosed the Dow Transports to its own record highs, and once that mania stopped, the index backed off. It remains long-term bullishly configured, which is remarkable considering the ascent of oil prices.The Dow Utilities has been playing jump rope with its trendline for years.Finally, volatility has crumbled to the lowest levels of the year, as fear has completely left the building.