
I’m not going to be saying much today as I’m not feeling well. Fortunately it’s Friday so I may well call it a day early today and go back to bed. If I trade at all today I’m going to be relying on the rest of the intraday trading team in the Princeton Trader trading room to do my thinking for me.
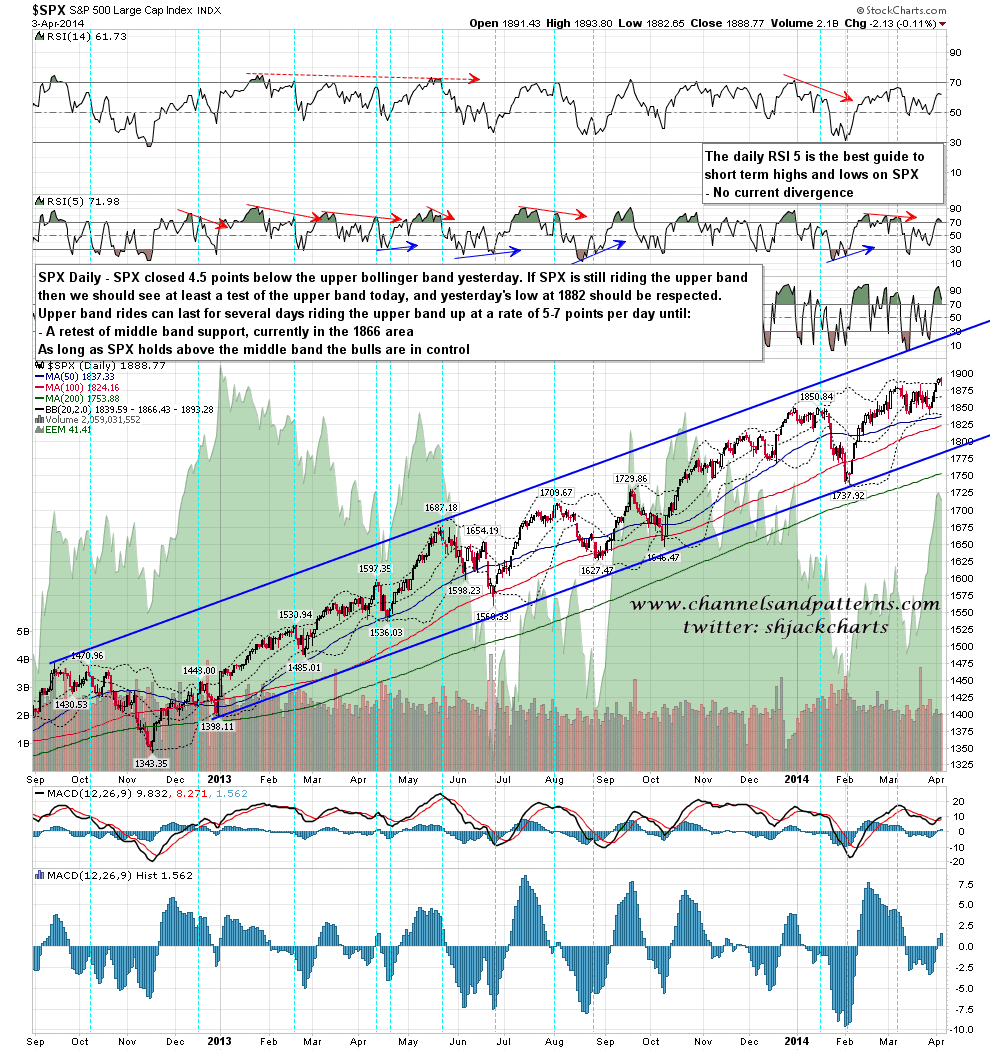
SPX closed 4.5 handles under the upper bollinger band yesterday. This doesn’t mean that the upper band ride has ended but it’s important that the upper band at least be tested today and that support at yesterday’s low at 1882.65 be respected today. If SPX has a strong day then I will be expecting the upper band to close today in the 1896-1900 range. SPX daily chart:
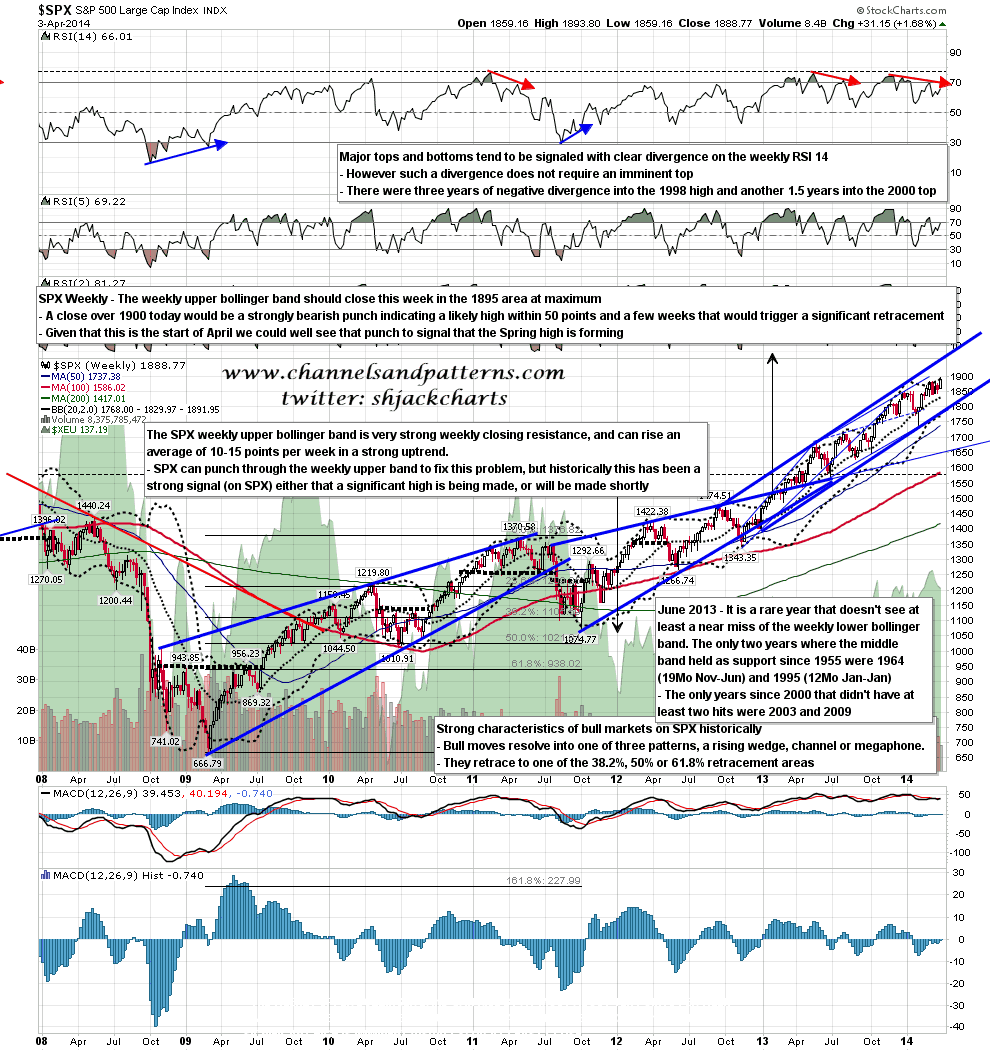
Today is the last trading day of the week, so the close today is important for the weekly upper bollinger band, which tends to be very strong resistance on weekly closes. I’m expecting this to close in the 1895 area at maximum, and there is some play of up to five points or so up to the 1900 area. Any close over 1900 would therefore be a rare and bearish punch over the weekly upper band, though given that we are now in April, a punch above today might just be signalling that the Spring high will be seen within a few weeks and 50 SPX points or so. On balance however I am not expecting SPX to close above 1900 today:
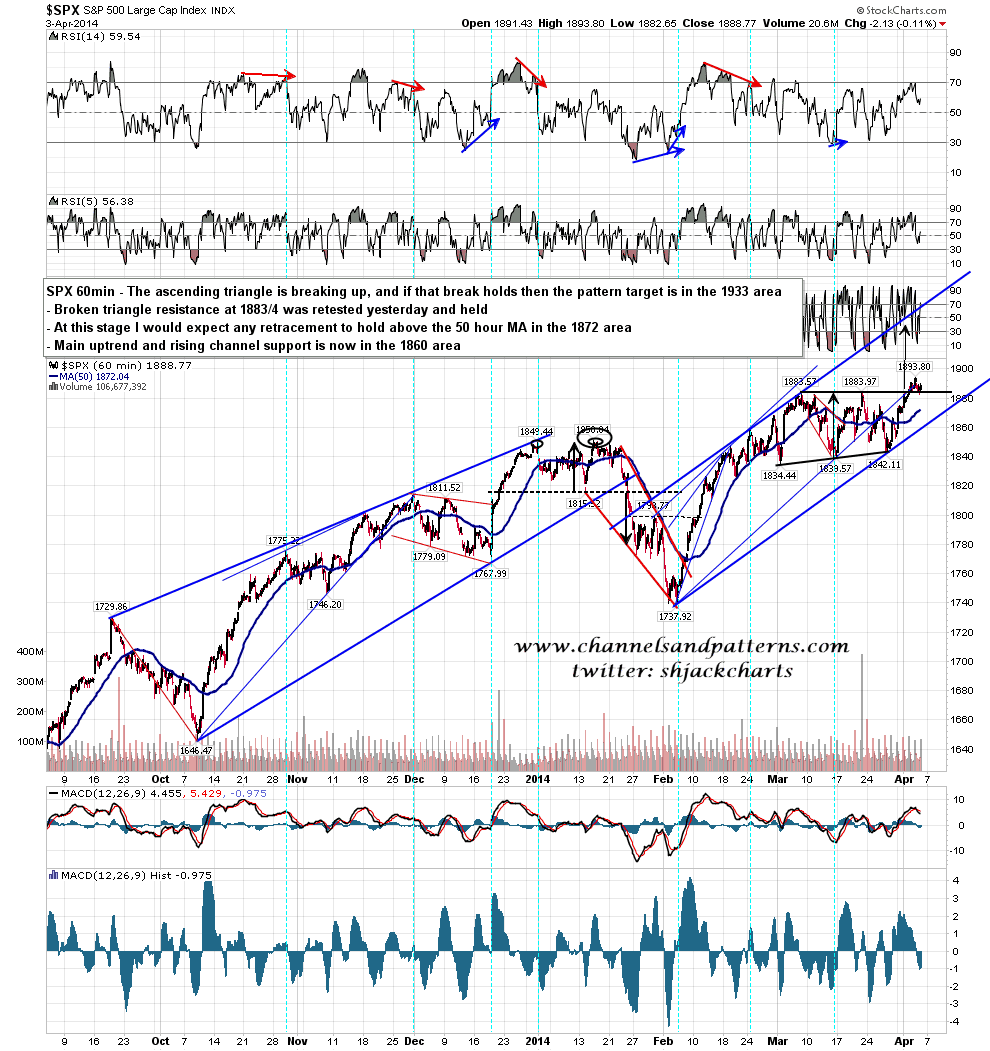
On the SPX 60min chart I was saying yesterday morning that I was expecting broken ascending triangle resistance to be retested this week, and that was retested at the low yesterday. Yesterday’s weakness ran to that and the highest level of ES support at 1876/7 that I gave yesterday morning. As long as yesterday’s low holds then the triangle target is in the 1933 area and I’m expecting to see that target made sometime in April. SPX 60min chart:
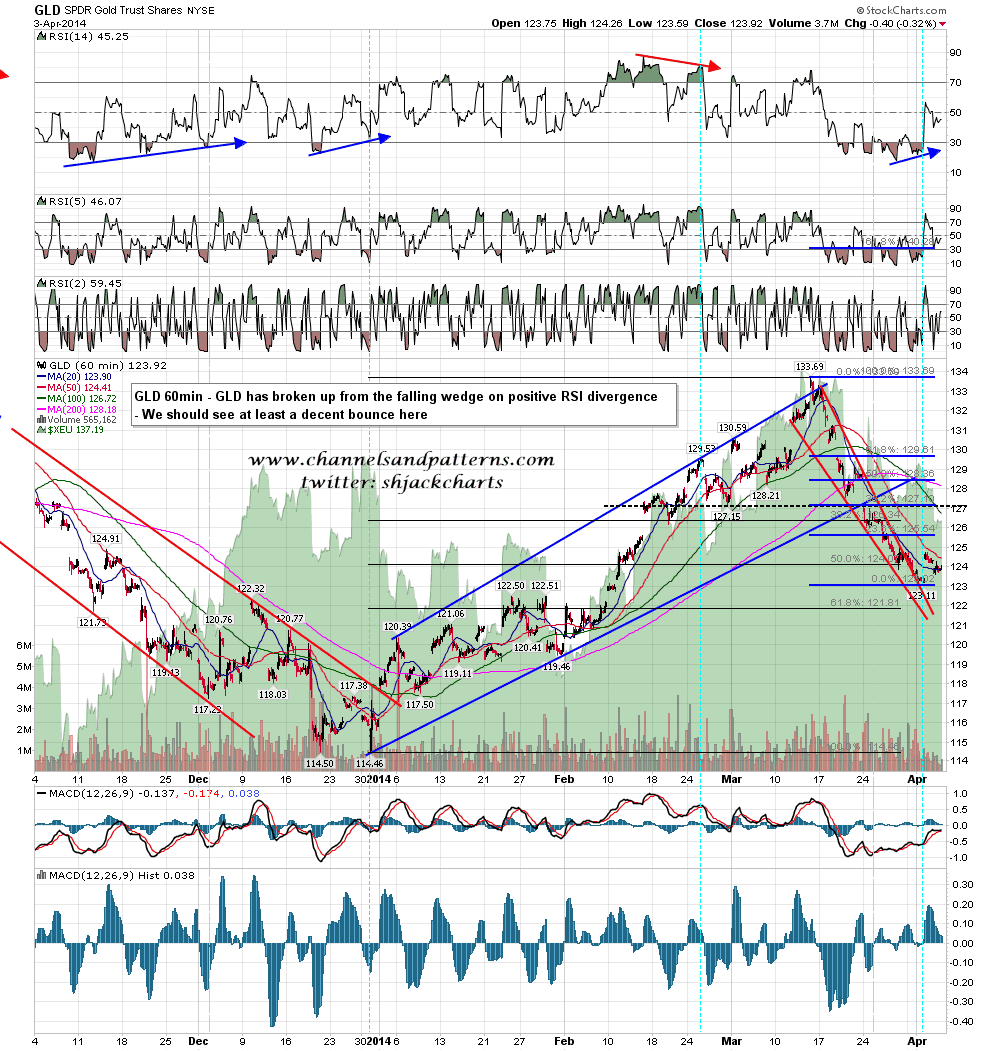
On other markets I posted a chart earlier this week showing a nice bounce setup on GLD. That bounce starts in earnest as soon as GC can take back and hold 1300, which is being tested at the moment. GLD 60min chart:
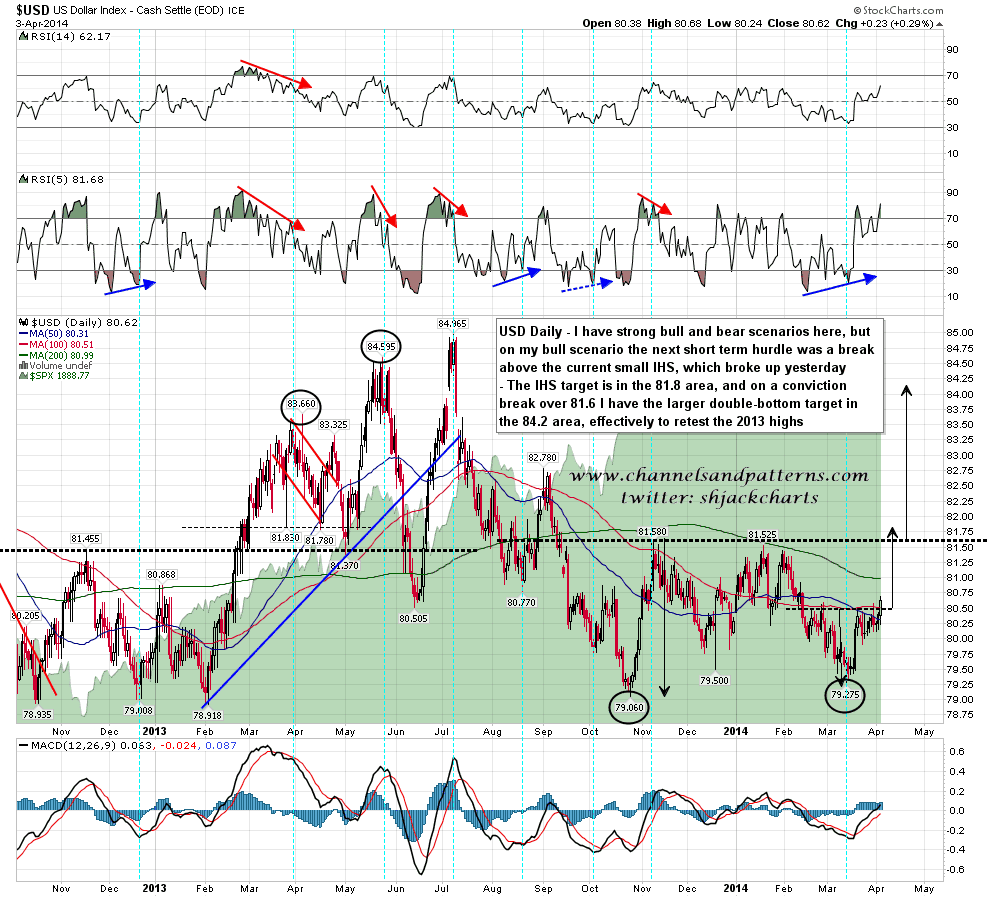
I have been reviewing a lot of charts to get an idea of direction on USD and the signals from those are very mixed. What I can say for sure is that most of those are predicting a big move starting soon. I’m leaning towards the USD bull scenario and that grew stronger yesterday with a break over short term IHS resistance. If USD can rise enough to break double-bottom resistance in the 71.6 area then USD should then retest the 2013 highs. USD daily chart:
I’m expecting to see yesterday’s low respected today and it will be a significant sign of weakness if it is not. I would be surprised to see SPX close over 1900 today.
