
The trading day today is likely to be dominated by the wait for, and then the reaction to, the Fed announcement at 2.15pm, so it may well be that news will trump the charts today, but that said, there are real signs of weakness here. On the ES 60min chart the rising channel from the low confirmed with third and fourth touches of the support trendline overnight before breaking down:

That's a nice support break with a double-top put in on Friday and Monday but that's not the whole picture as a perfect bearish broadening ascending wedge has also formed since the low on Monday, and at the time of writing support on that wedge is still holding. If that breaks down through support, currently at 1195, then the target will be a retest of Monday's lows. I'll be waiting for that break down though, as the upper trendline of the wedge is currently at 1226 and rising rapidly:

The SPX chart looks bearish too. A small rising wedge from the last low broke down on Friday. I posted that on twitter at the time. After yesterday's double-top the adjusted rising support trendline from the last low then also broke at the close yesterday:

Looking at the NDX 60min I have a rough rising wedge from the August lows that suggests that we may have seen a short term swing high yesterday. The trendline quality is poor however, so I wouldn't put a great deal of confidence in it:

The support trendline on the RUT 60min is a bit rough too, but there is a decent triangle there suggesting a high on Friday and with the next downside target at triangle support in the 670 area:

Looking at the Vix 60min over the last three months, I have a rough support trendline fan developing with Vix breaking support trendlines and then retesting them. Unless Vix is about to break the current rising support trendline then the next obvious target would be the second retest of the last broken support trendline just over 36:

I know a lot of people believe that a major swing low on equities has already been put in, but while This bounce off the August lows has been dragging on somewhat, I don't think the technical picture supports that view. I'll post a couple of charts in support of my view and they're obviously related. The first chart is the EEM daily chart vs SPX, where the last two major lows in 2009 and 2010 were both signalled with sharp positive divergence from EEM, which bottomed earlier in both cases. As you can see EEM has been lagging SPX since the August lows and is still close to those lows even now:

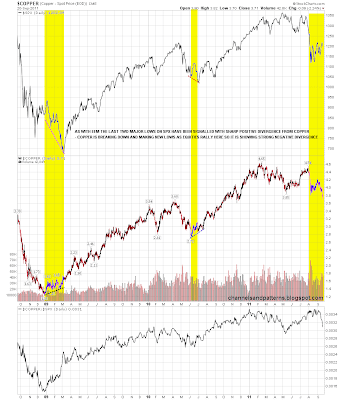
There's a similar situation on copper, which like EEM signalled the last two lows with sharp positive divergence as SPX continued to fall. As you can see copper is even weaker than EEM at the moment and has broken to new lows over the last few days. This doesn't mean that the bulls must be wrong, but it isn't supporting their view at all:
As I've been writing the broadening ascending wedge on the ES 15min chart has broken down with a target at Monday's lows. That isn't far below and I'm thinking that we may well see that test of Monday's lows before the Fed announcement. After that is harder to call, but unless we see the Fed announce something unexpectedly impressive I'm leaning cautiously short on all timeframes.
