
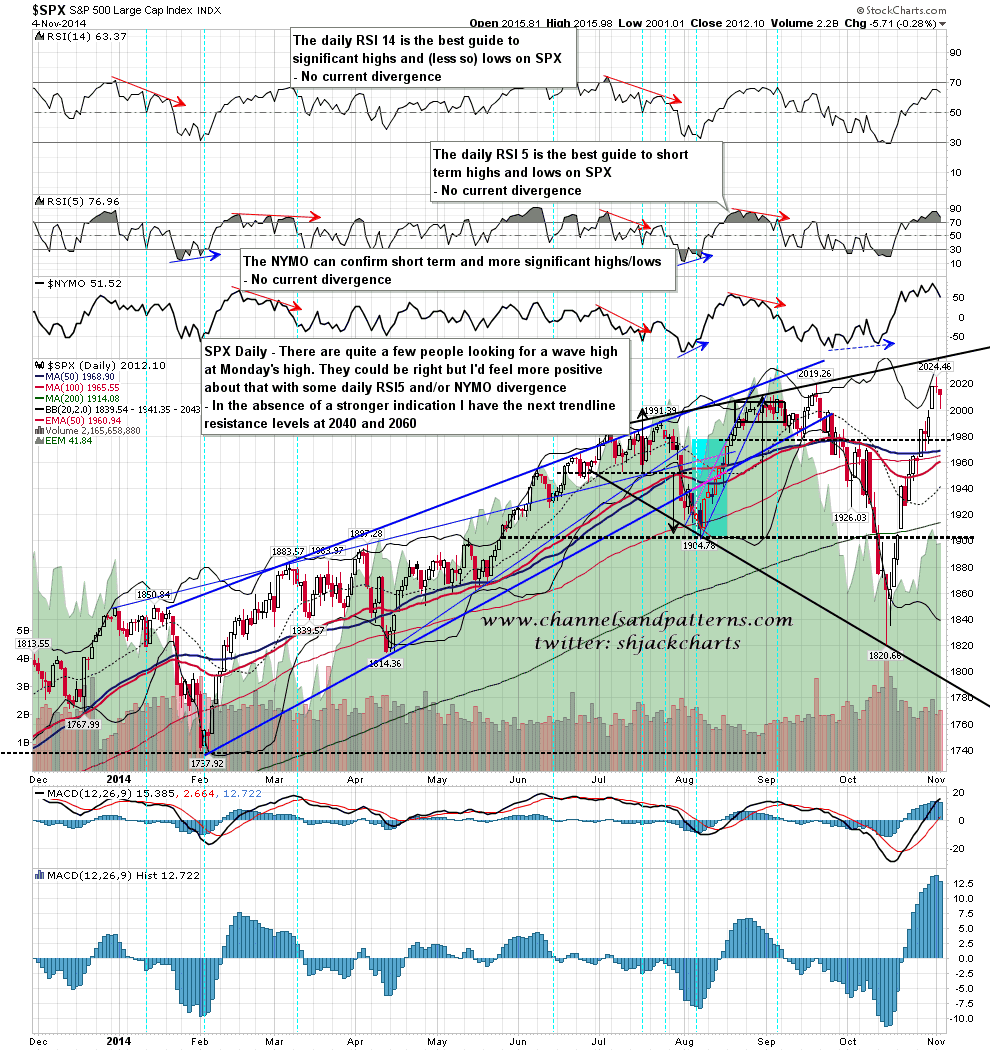
SPX declined modestly yesterday, bottoming out at 2001, just above the 1995-2000 target range I posted in the morning, and has recovered strongly overnight. As I said yesterday I’m not seeing anything to strongly suggest a high here and am looking at trendlines in the 2040 and 2060 areas for resistance. If we see a break below 1992 today I may reconsider that view. SPX daily chart:
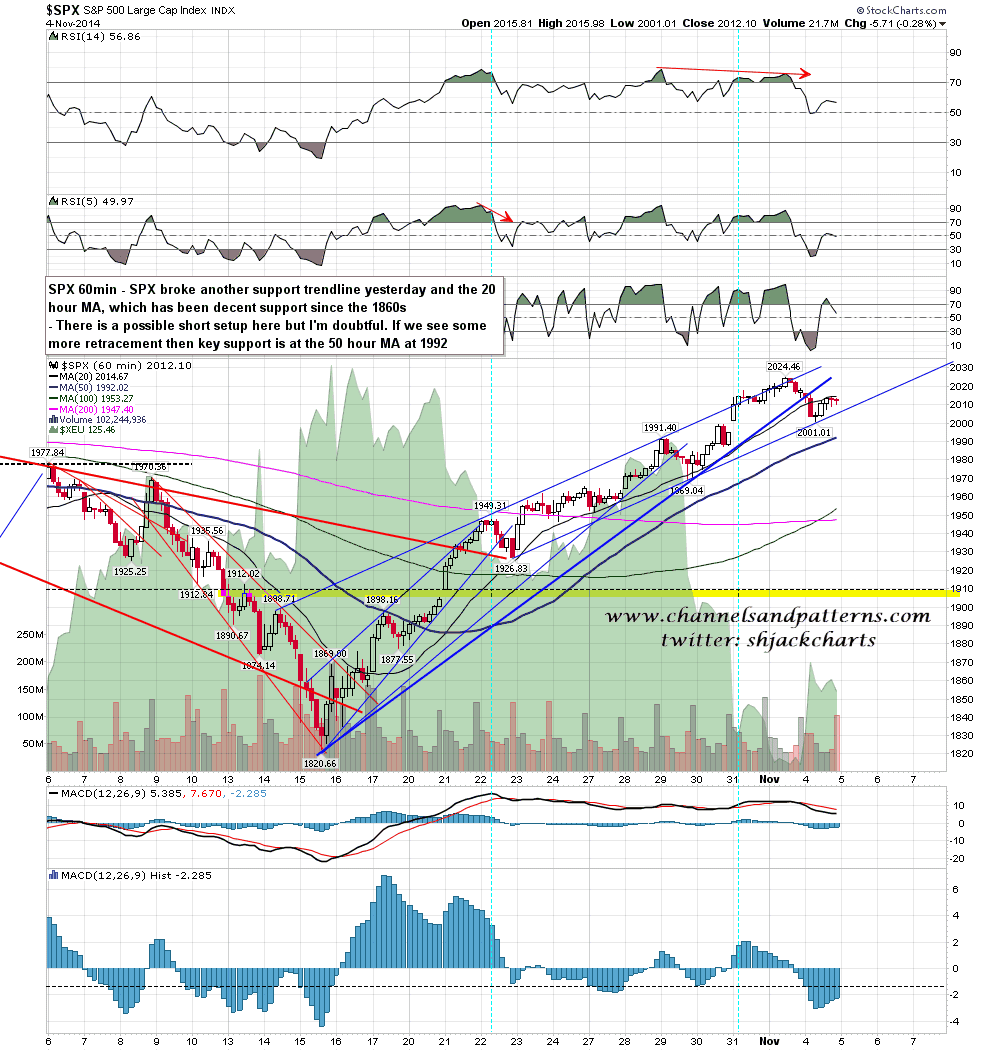
The 60min chart is leaning somewhat bearish. There was a trendline break yesterday and the first break below the 20 hour MA since the 1860s. Main support on the 60min chart though is the 50 hour MA at 1992. That hasn’t been tested since 1890 and is main uptrend support. I’m not seeing a pattern setup here yet that strongly suggests that the wave up is finished or finishing. SPX 60min chart:
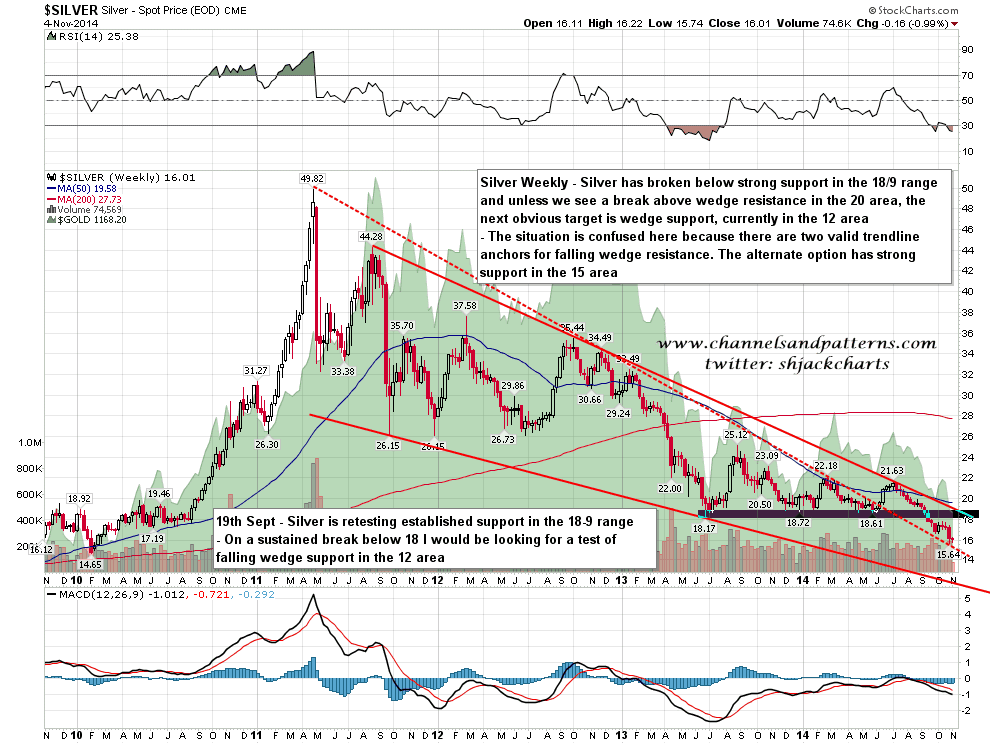
Silver is now at my first downside target area near 15. This could hold. If not my next target area is 12, which would be a very clear area to go long. Silver daily chart:
When this huge move up on SPX ends there should be a ripper of a retracement, and I’m watching for that. It could very much go higher before topping out though and that is not a party to arrive early to. As long as the 50 hour MA holds as support and I don’t have a supportive pattern setup or a daily sell signal I am assuming that any dips here should still be bought.
