
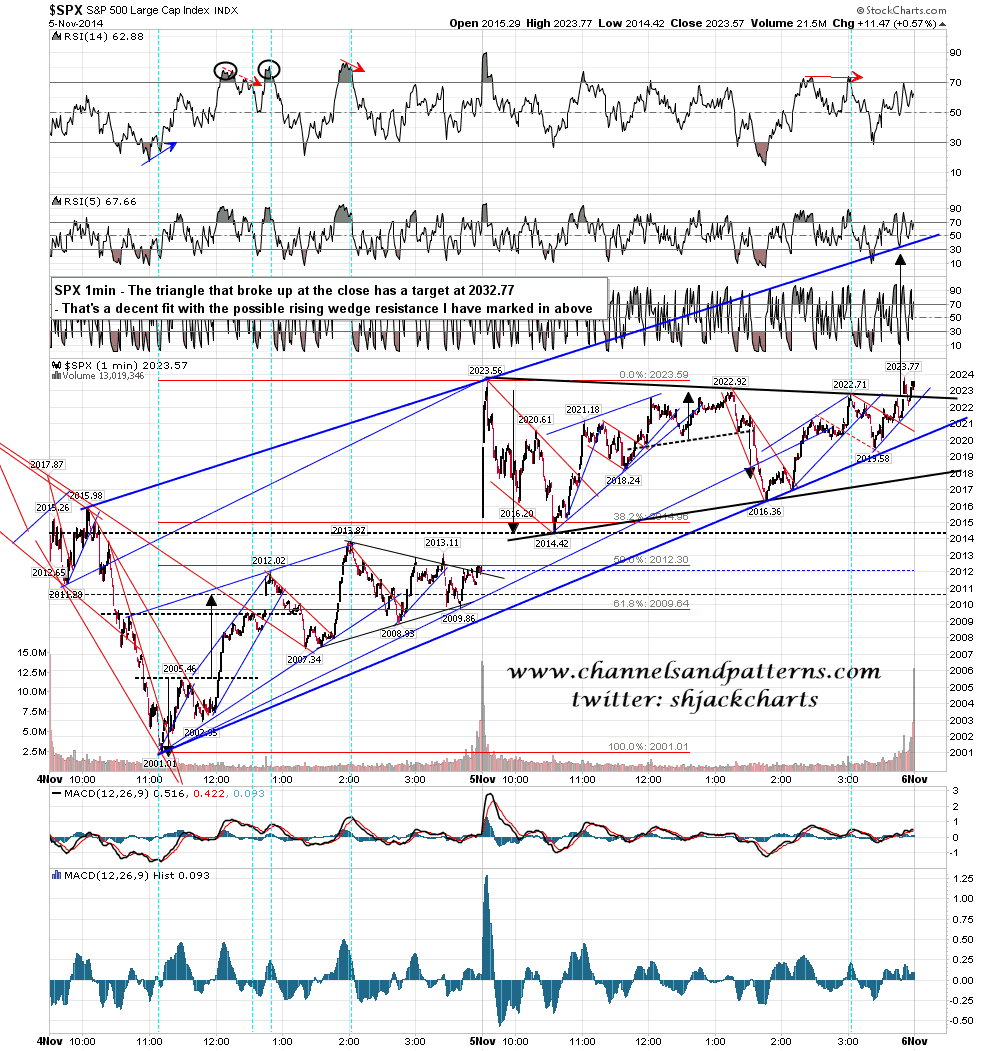
I posted the chart below on twitter last night. It shows a triangle breaking up on SPX at the close with a target in the 2033 area. Triangles are slippery patterns and this one could yet reverse and break down, but my lean coming into today is bullish. SPX 1min chart:
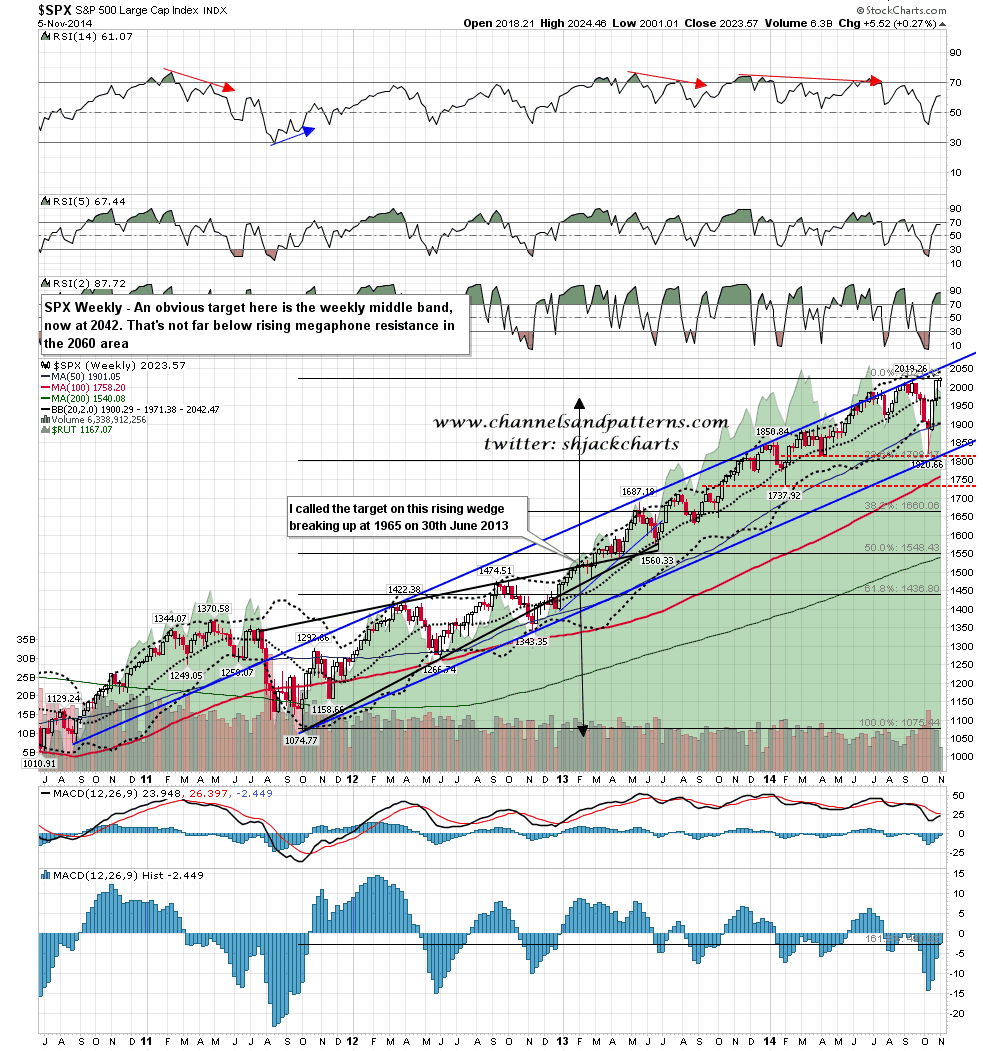
If we see 2033 then there is an obvious target not far above at 2042 and that target is the weekly upper band. I also have some trendline resistance in the 2040 area that I mentioned yesterday. SPX weekly chart:
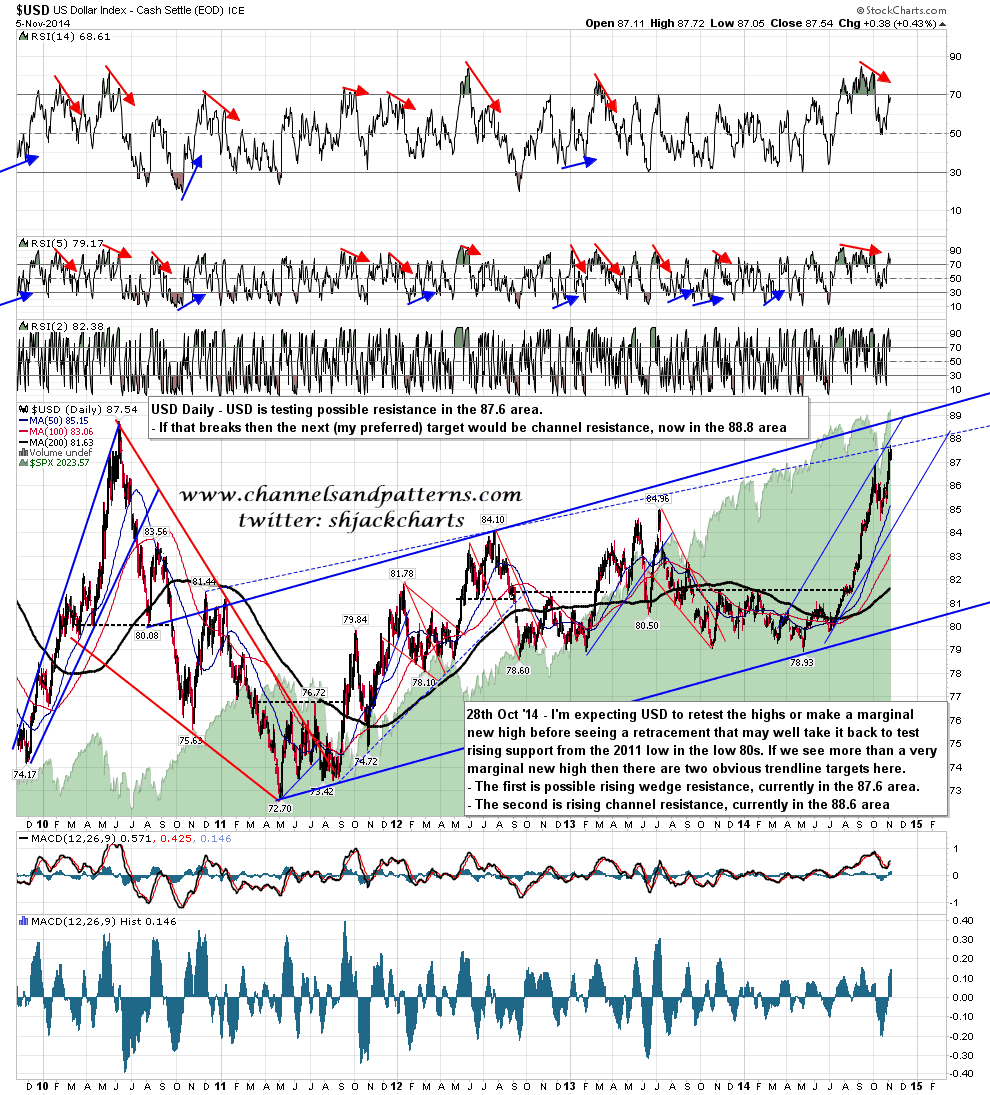
The US dollar is testing my first target trendline in the 87.6 area. That may hold but my preferred target is rising channel resistance in the 88.8 area. USD daily chart:
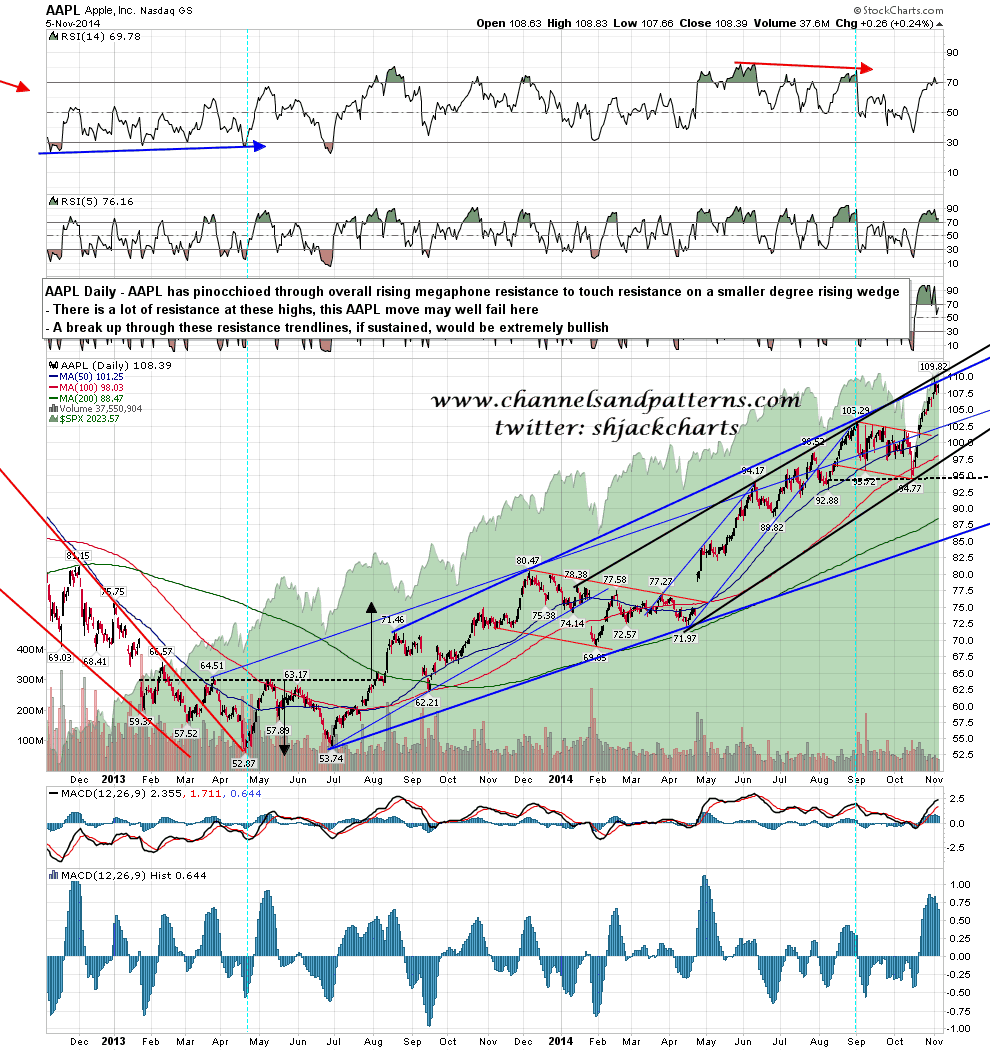
AAPL is testing double resistance at the highs here. Normally I would expect a strong fail here but this is AAPL so it might go the other way. AAPL daily chart:
As long as yesterday’s low at 2016.36 holds I’m leaning long today. I’m writing a new Brave New World series post with some scenarios based on the current wave up and that should be out today or tomorrow.
