
I hope everyone had a great Thanksgiving, and that none of you were long enough oil-related instruments for OPEC to upset your digestion. We are seeing a weak looking open today and in part that may be due to the break below $70 on oil, though on all three trading days so far this week we had a significant move down either from or before the open, which then wasn’t followed through. .
I’m skeptical about the prospects for the bears today. This will be a holiday half-session on low volume, and the stats for the last trading day in November are impressively bullish, with SPX closing up 6 of the last 7.
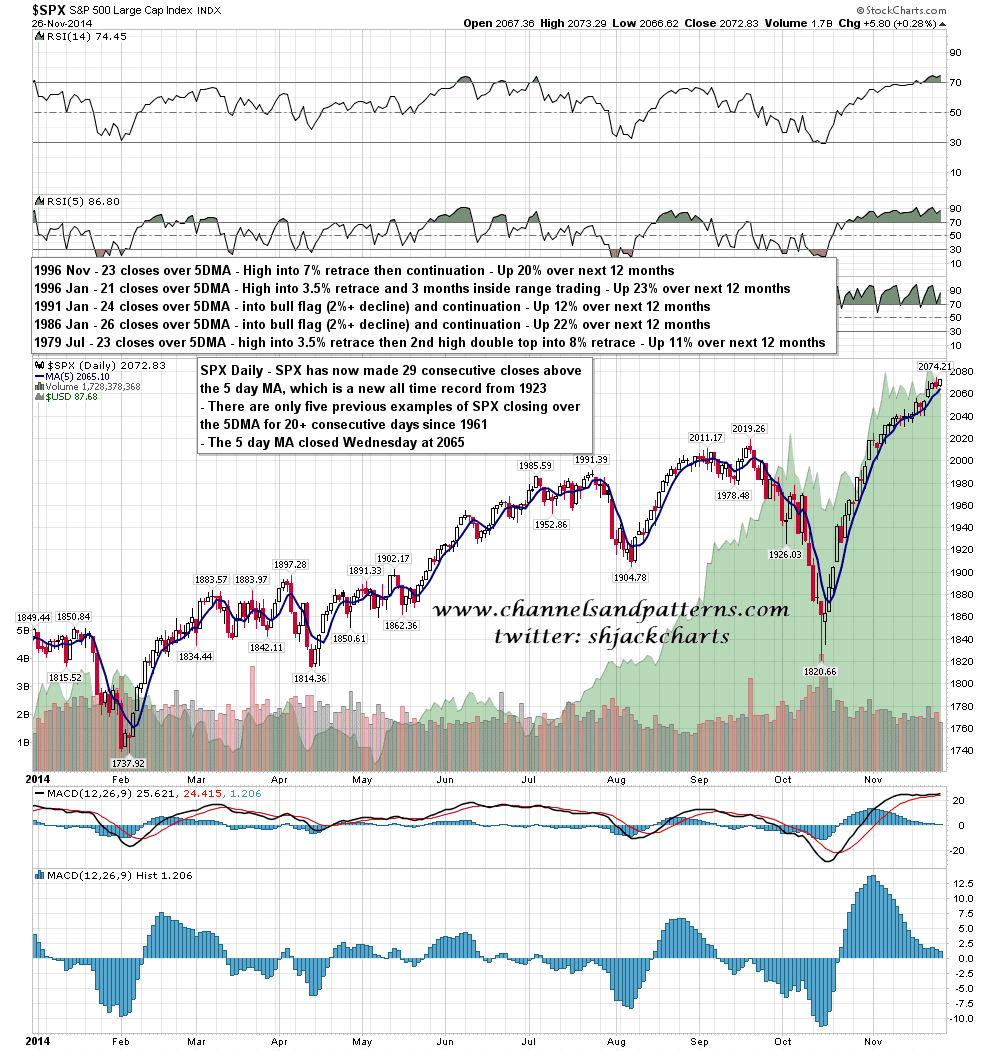
The close on Wednesday delivered another close above the 5 DMA, and another new lifetime high on SPX of 29 consecutive closes above the 5 day MA. If the bullish historical stats for today deliver then we will see SPX make another lifetime high at 30 above today. It wouldn’t take a big move to end that run here though, as the 5 DMA is now at 2065. SPX daily 5 DMA chart:
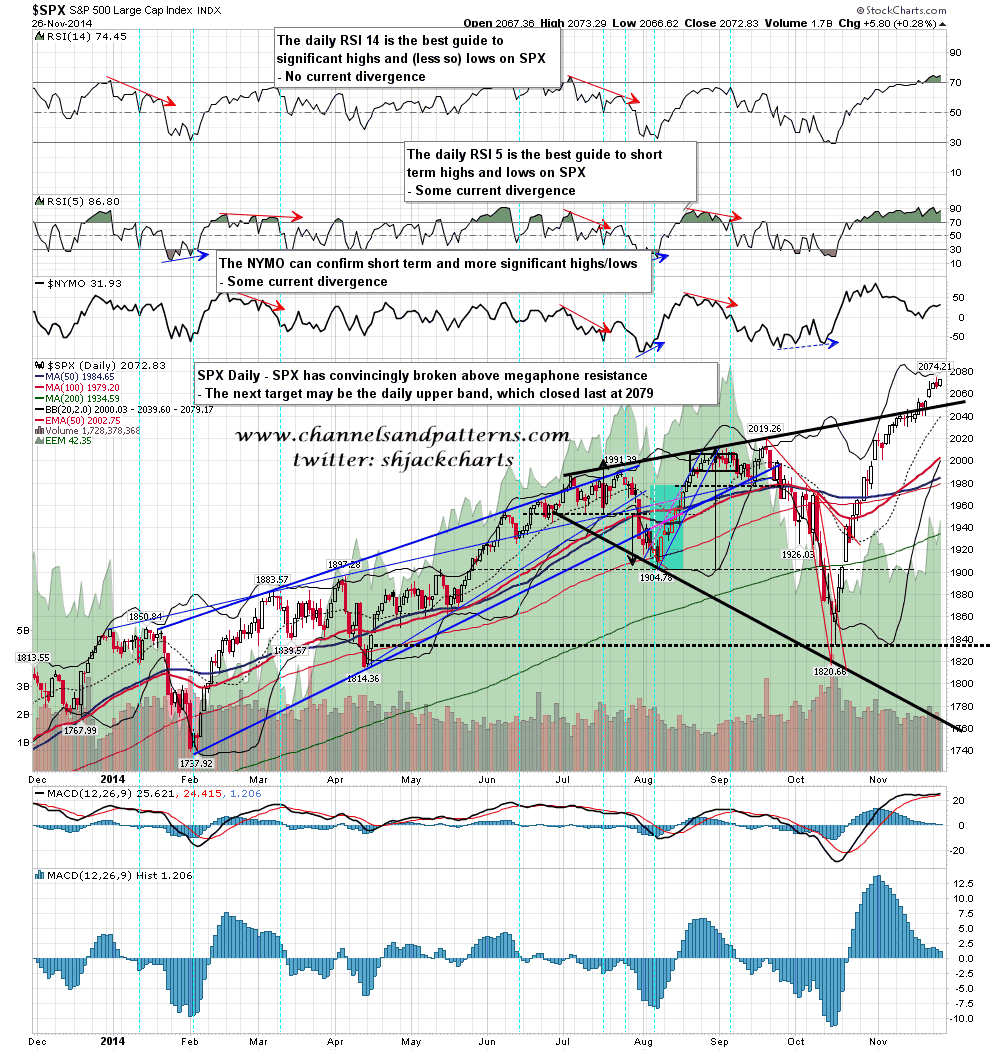
If we do see a move up today, and SPX makes another all time high, then there is an obvious target and resistance level at the daily upper band, which closed on Wednesday at 2079. SPX daily chart:
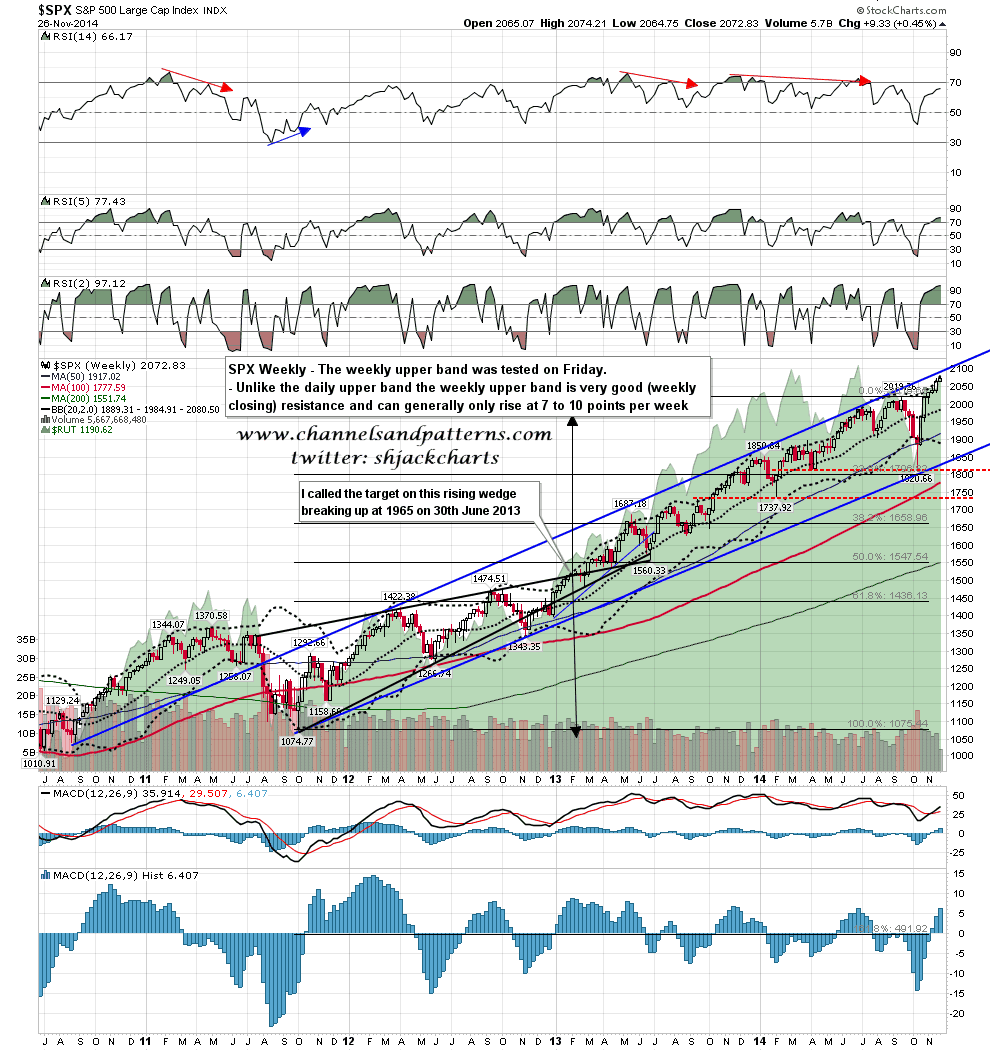
Just next to the daily upper band is the weekly upper band at 2080. We shouldn’t see a close above that today. SPX weekly chart:
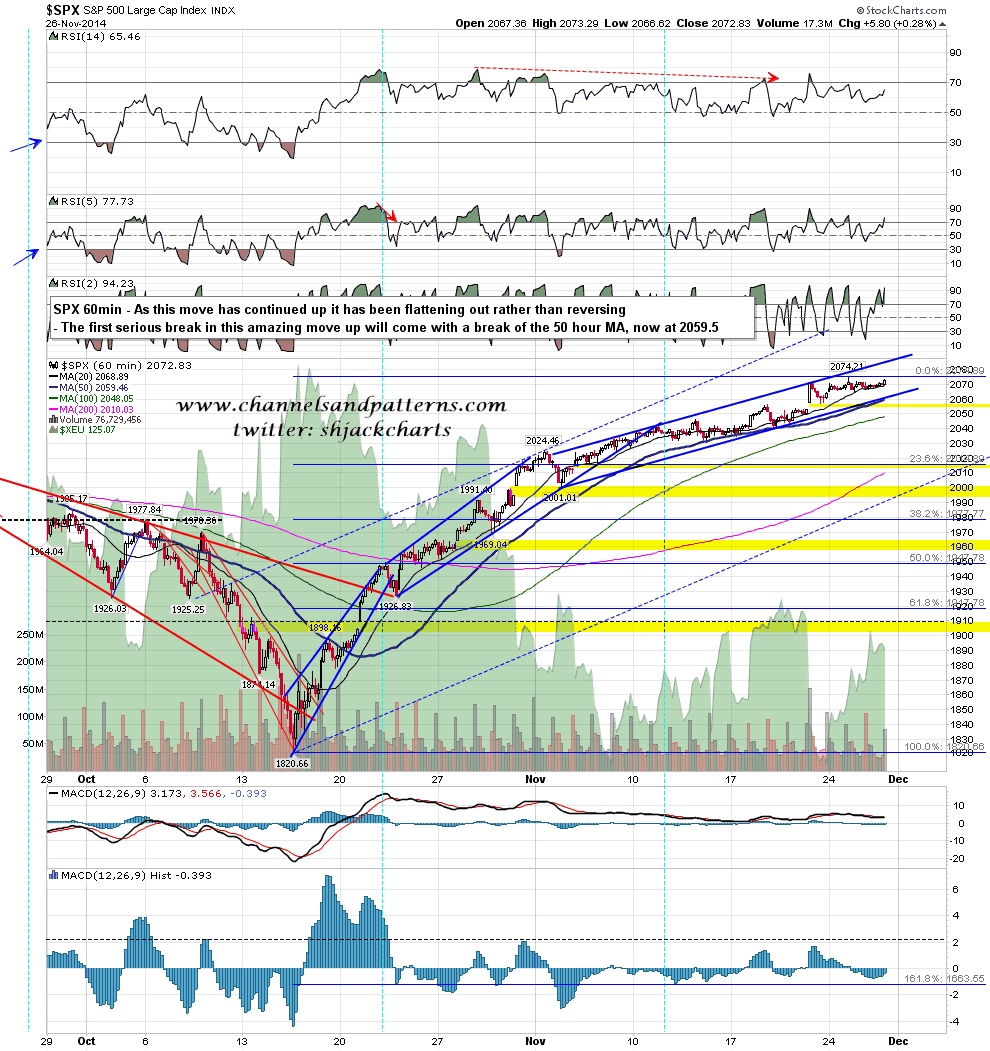
On the downside the 5 DMA at 2065 is closing support of course, and main uptrend support is at the 50 hour MA, which last closed at 2059.5. Until that can be broken with confidence this uptrend is still going strong, though you can see on the chart below that each move up has been weaker and shallower than the one before. SPX 60min chart:
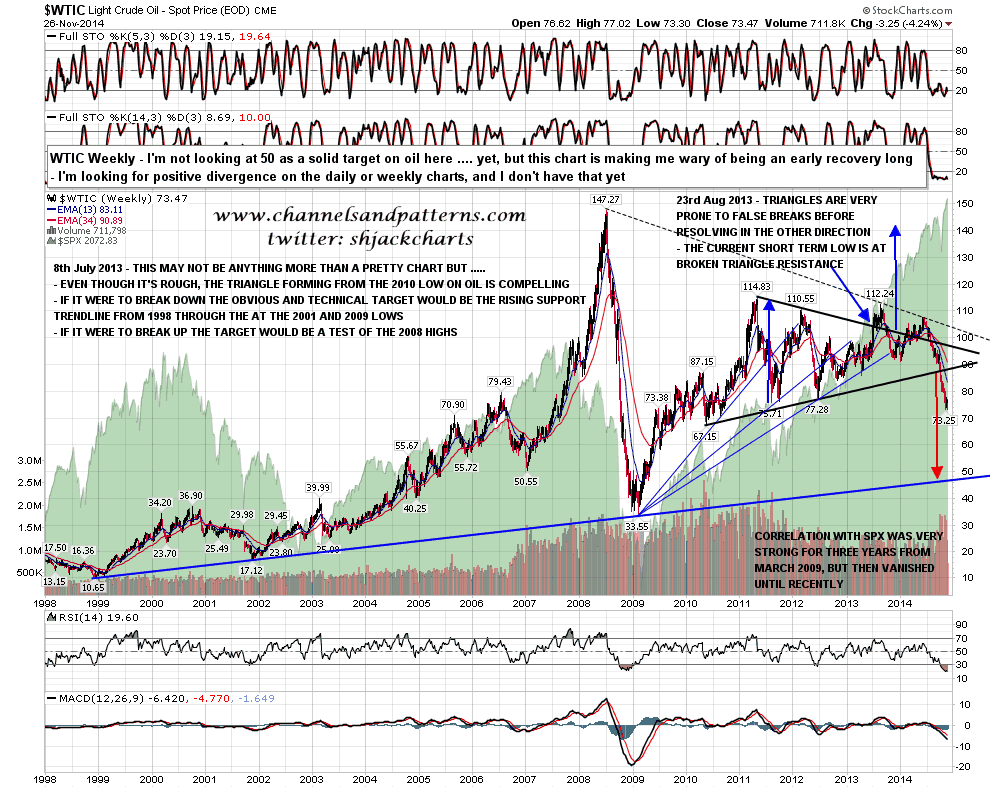
I haven’t got time for a detailed look at oil today but the sharp move down in oil on Friday is prompting me to post again my lowball target for oil on this move, which I haven’t been taking particularly seriously but is now coming into view. I posted this chart on 8th July 2013 talking about a possible move to a triangle target at the strong rising support trendline from 1998, and I have that currently in the $48 area. That’s something for oil longs (and shorts) to at least bear in mind here. WTIC weekly chart from 1998:
I didn’t manage to get my USD and EURUSD post out yesterday. I’ll be trying to get that out at the weekend. Everyone have a great weekend 🙂
