
As I suggested in my post yesterday, a weak open snowballed into a bigger move down and my target rising wedge support trendline was almost touched at the low yesterday afternoon. That should be hit today or tomorrow though we might see a bounce first to establish a double bottom. I’m expecting wedge support to hold or to be broken only slightly, but if we see a conviction break then it’s well worth noting that there is a double top setup here that would target the 1851 area on a break below December’s low at 1972. SPX 60min chart:
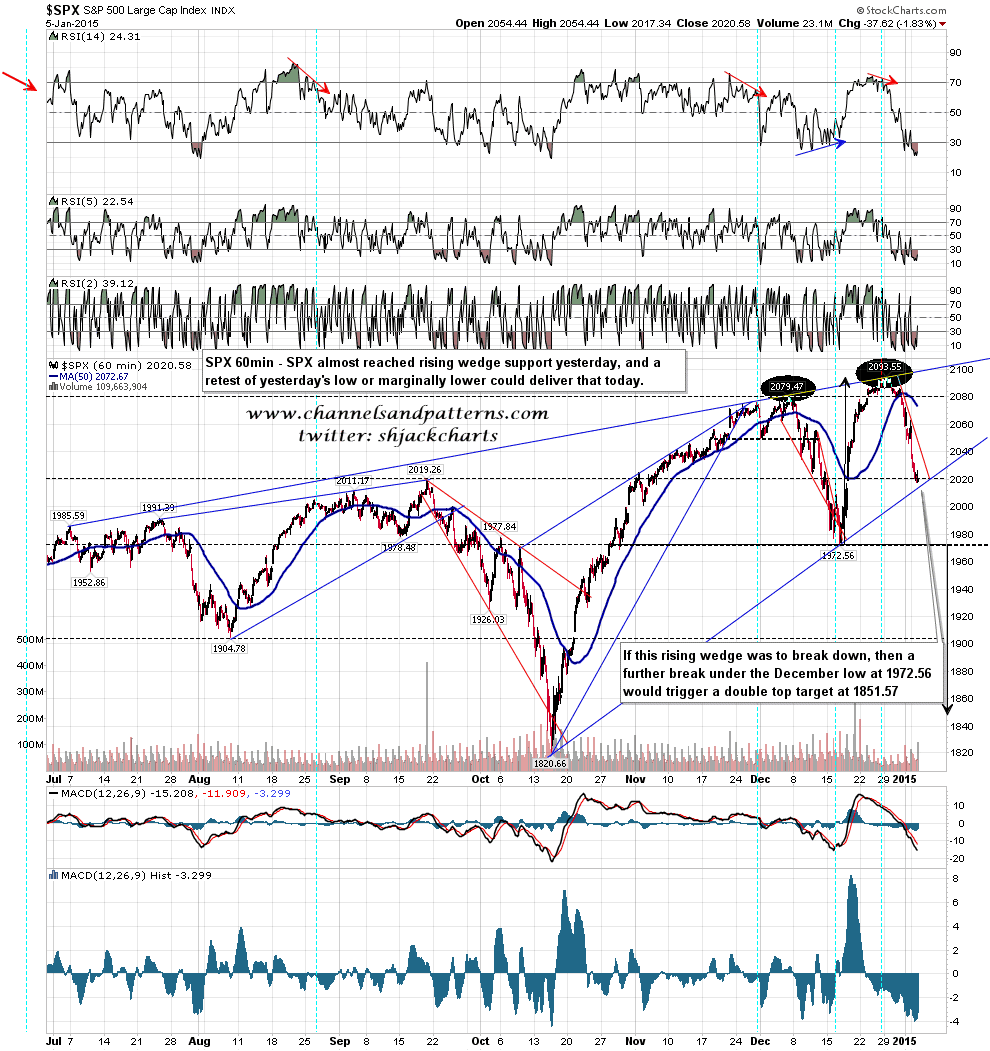
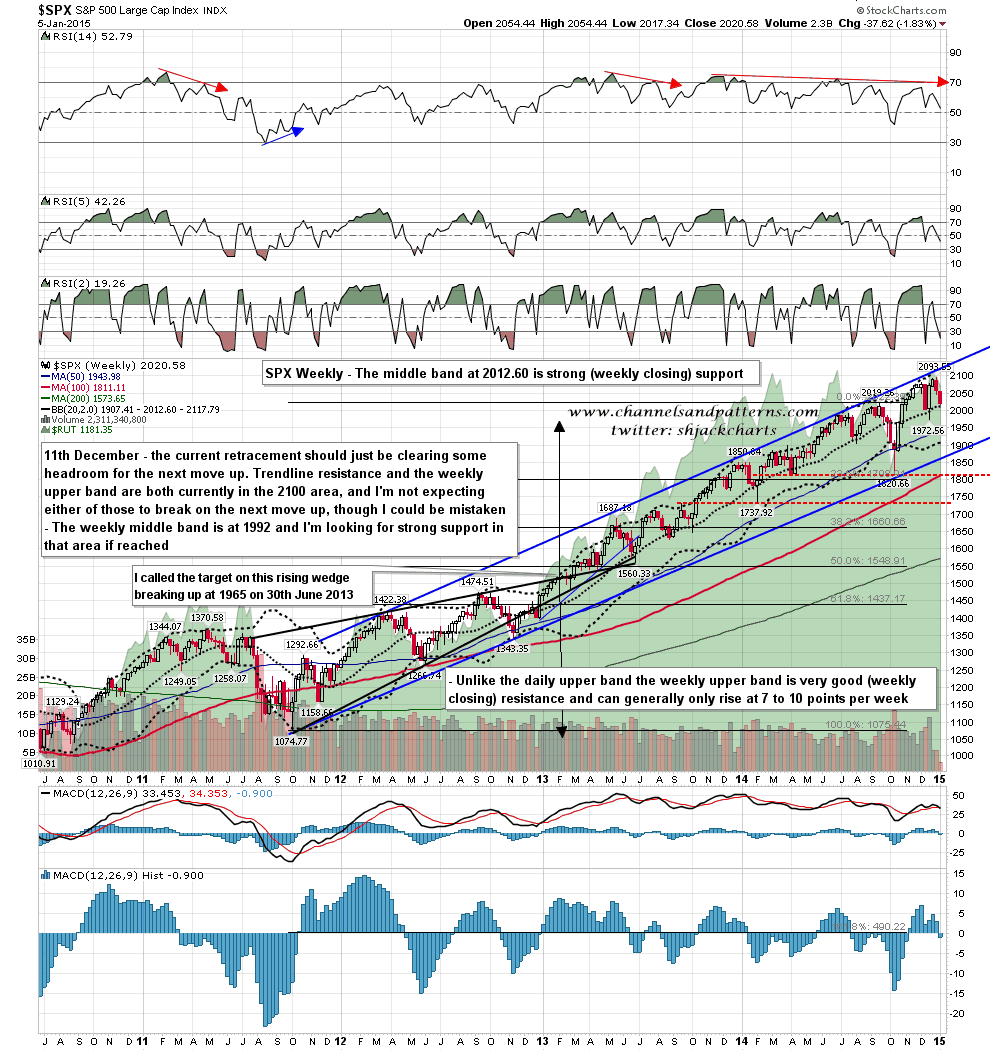
That possible target at 1851 is a match with rising support from the October 2011 lows. That was the trendline that I expected to be tested in October and wasn’t, and it is unfinished business below. If the rising wedge breaks then I would be considering that a very serious target. Short term though I’d note that there is strong (weekly closing) support at the weekly middle band at 2012.60, and that is a decent match with rising wedge support here. SPX weekly chart:
Back in July 2013 I posted a triangle on oil which, depending on the final direction of the break would either retest the 2008 highs, or test rising support from the 1998 low. With CL’s break below 50 yesterday that strong support trendline is just below in the 47/8 area. I’d be surprised to see that trendline break, so I’m looking for oil longs here. WTIC weekly chart:

There’s no positive divergence on the WTIC weekly chart yet but there is on the daily chart, and that looks ready to go at the first real sign of strength on oil. As we may well see a big rally on oil before that trendline is hit, then I’m looking for an interim low that could be made at any time. WTIC daily chart:

If we are to see a retest of the highs, which I favor, but not as much as I did before yesterday’s declines, then I’m looking for a test of rising wedge and weekly middle band support in the 2013-7 area to make this retracement low. If that rising wedge support trendline breaks then we may well test 1850-60 before we see another big run at 2100.
