
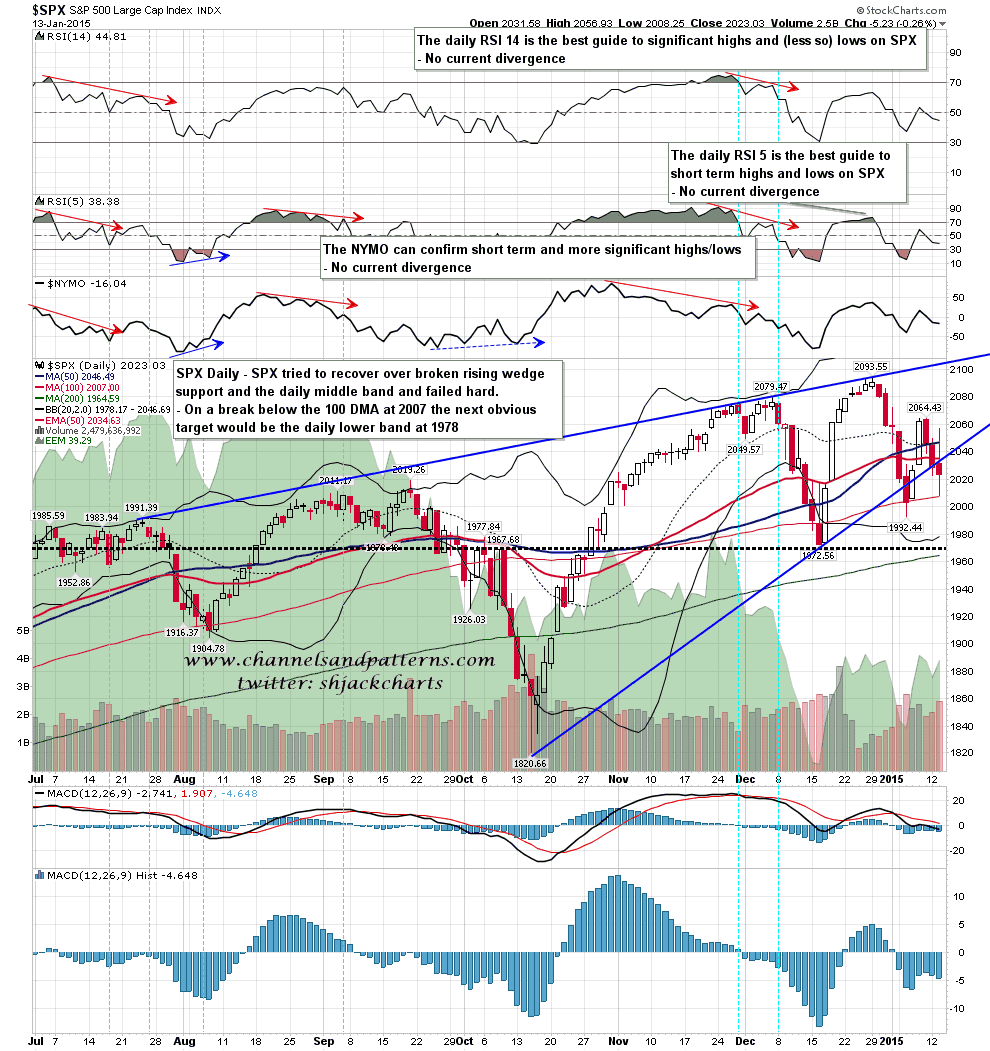
When I was presenting my mixed picture yesterday morning I wasn’t really considering the possibility that both my bull and bear scenarios would then play out in sequence, but that’s what happened with the bull scenario playing out and failing at the declining resistance trendline from the all time high, and then a hard rejection and break below the previous day’s low. This was in effect an attempt to recover over both rising wedge support and the daily middle band and that attempt was crushed, again. SPX daily chart:
The wild action has continued overnight with a move to 1996.25 ES, then a 23 handle rally to 2019.5, and then a 34 handle plunge to the globex low at 1985.25. ES is rallying from there at the time of writing.
So where does that leave SPX today? Well obviously the bulls are having very serious performance issues and the fail at declining resistance yesterday gives two obvious trendline targets for the current move. The first is possible triangle support, and I have that in the 2000 SPX area. If that fails then the obvious target would be falling channel support, currently in the 1972 area at the retest of the December low. SPX 60min chart:
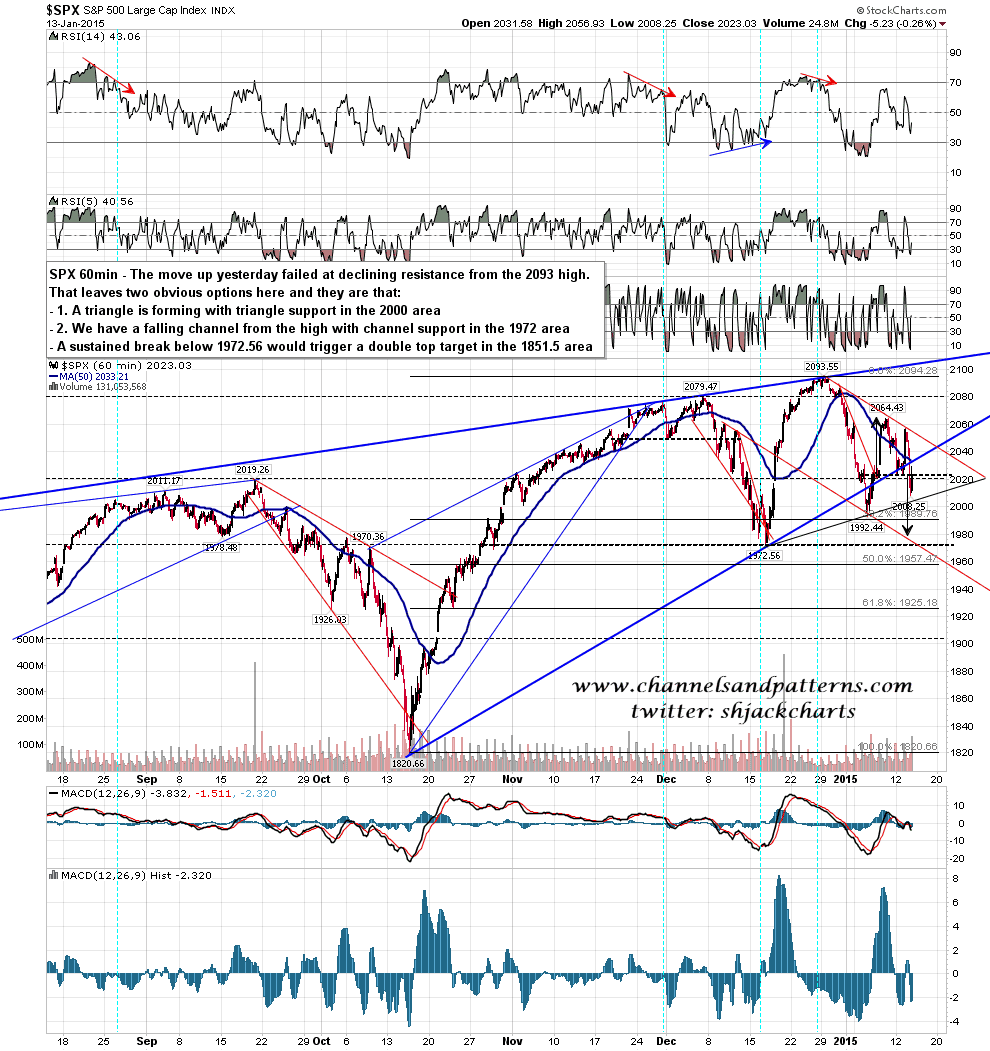
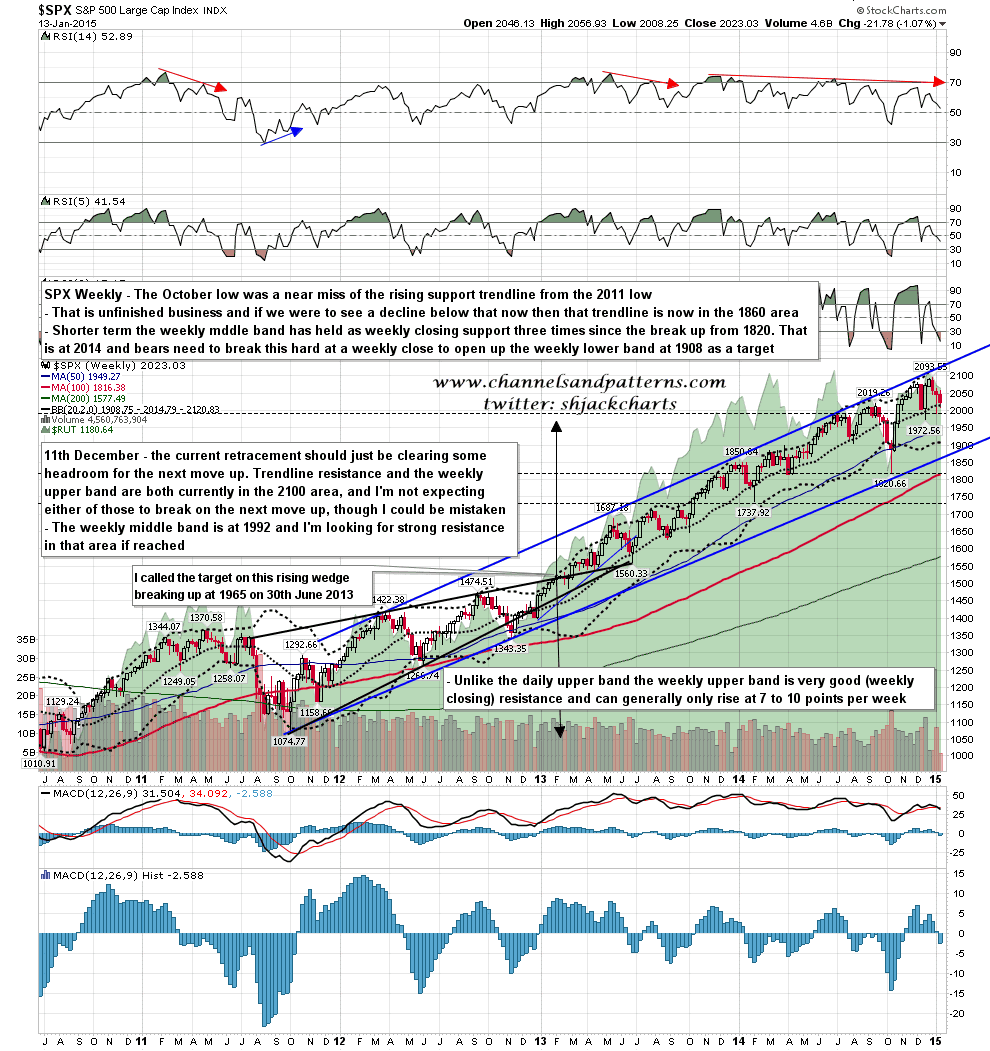
That 1972.56 low is also of course double-top support and on a sustained break below that the double top target would be in the 1851.50 area. That’s a decent match with a test of rising megaphone support from the 2011 low and that is unfinished business, so I wouldn’t be at all surprised to see the 1972 level break on a retest. SPX weekly chart:
We have actually seen much of a decline yet, but this tape is in full bear mode, with lower highs and lows, and powerful rallies which then fail hard. All rallies are sells until we see a break over declining resistance from the high and one of these breaks to the downside may accelerate into a decline comparable with the decline in October.
