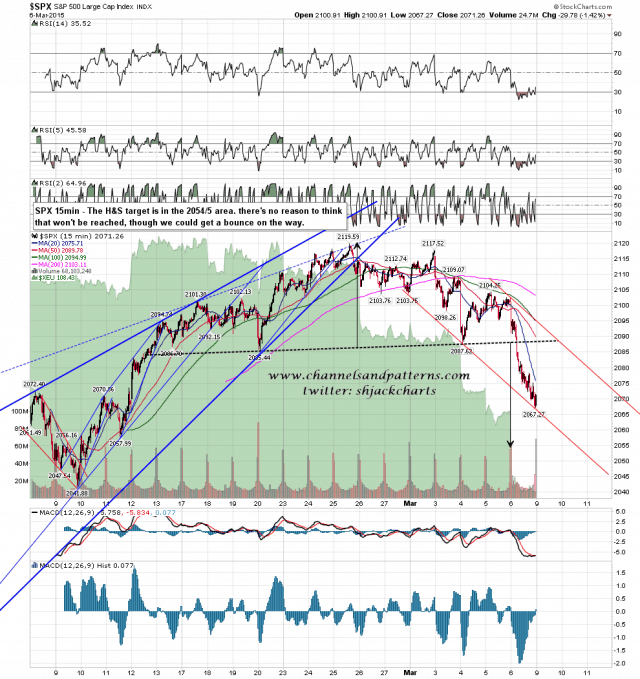
The H&S on SPX broke down on Friday and that has a target in the 2054/5 area. SPX 15min chart:
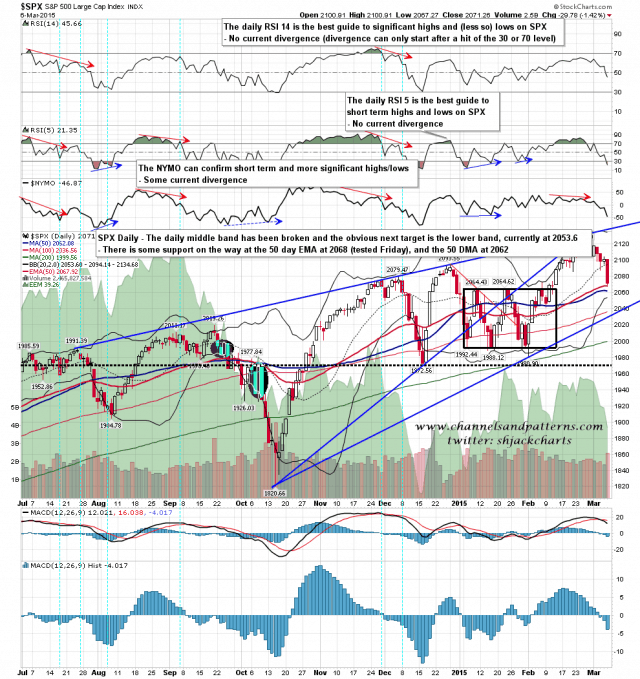
That target is backed up on the daily chart by the daily lower band being in the 2053.6 area. SPX daily chart:
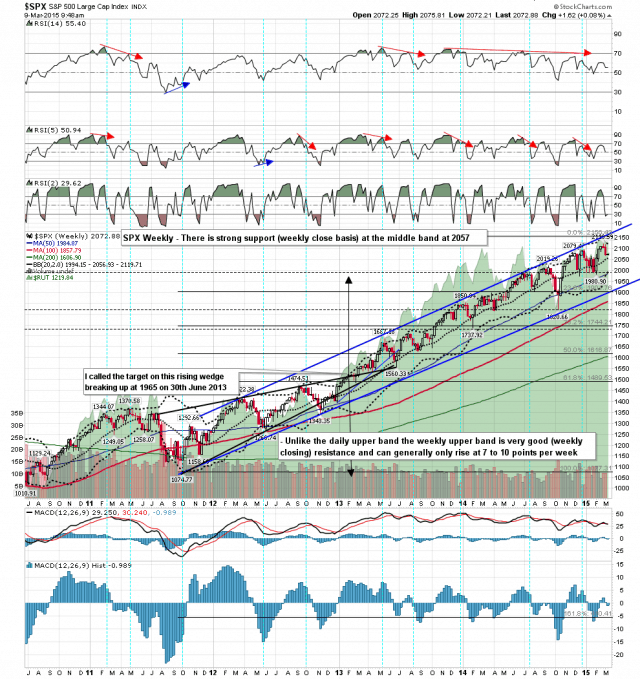
That target is also backed up on the weekly chart by the weekly middle band being in the 2057 area. SPX weekly chart:
There is a very clear support cluster in the H&S target area and that strengthens the already high probability pattern target at 2054/5. I think that target will be made, possibly today, and that we should see at least a decent bounce at that support. We may of course see a bounce on the way as well, but that should just be a rally to sell.


