
ES had a very strong day yesterday and broke back over resistance at the weekly middle band (now at 2063), the 50 hour MA (now at 2069), the 5 DMA (now at 2072), and the daily middle band (now at 2073.5). The stats are bearish for today and we may well see a retest to establish whether the resistance broken yesterday will now act as support. If so then I would be very edgy about any significant break under the 50 hour MA at 2069 and on any break under 2067 I’d be expecting a full reversal candle breaking back below the daily middle band today.
I’ve written a few times in recent weeks about the unusual 5 DMA setup here. I’ve looked back as far as the start of 2007 without finding a single example of a decent break over the 5 DMA, that was reversed within two days, that did not then deliver a lower low before higher highs. As SPX stands here we have had two such breaks in the last four weeks and since then SPX has neither made a low under 2039, nor a higher high over 2119. SPX daily 5DMA chart:
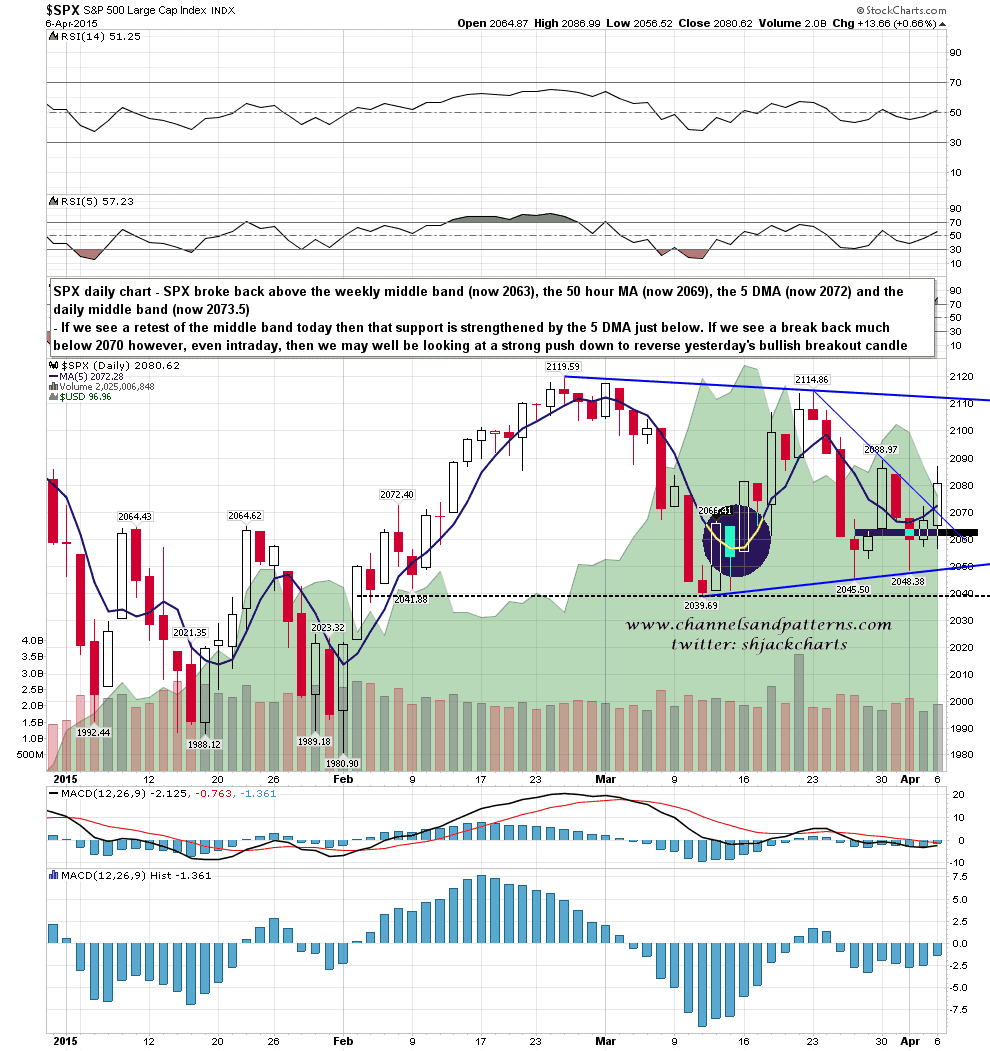
Either we break down to take the 2039 low out in the very near future or the triangle I have been looking at is forming, and we will most likely find out which at the retest of the daily middle band today. If the middle band holds, then I have triangle resistance in the 2112 area, and if the middle band folds then I’d be looking for a break back below 2039 in the near future, most likely this week.
SPX 60min chart:
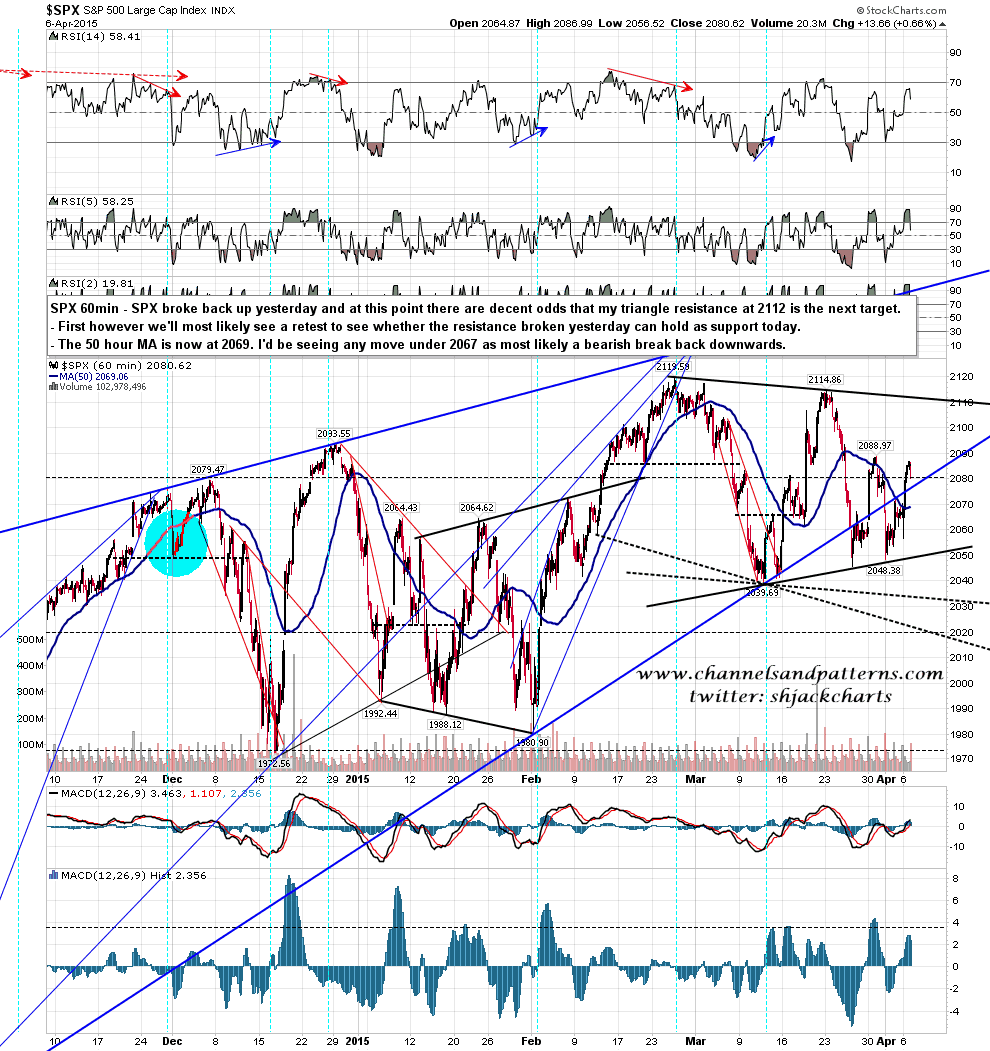
The support zone this morning is in the 2067-73 range, and bulls need to hold it to go higher. Any break back below it, even intraday, is most likely a bearish break that will follow through. Overhead resistance, which I’m not expecting to see tested today but might be in any case, is at 2088.97 and if bulls can break over that level they will have made a significant looking higher high.
