
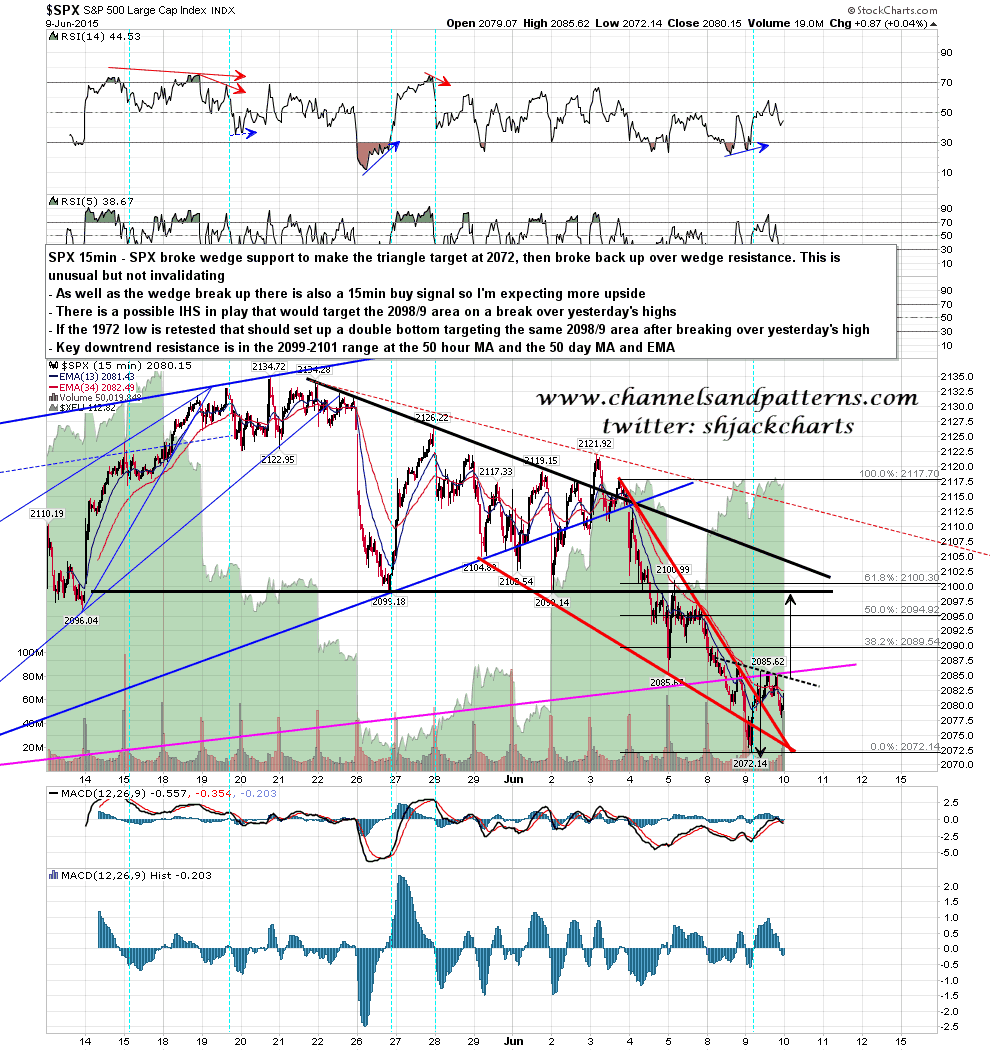
SPX had me worried yesterday morning when falling wedge support broke, but it reversed at the 2072 triangle target and broke right back up. This is unusual but perfectly valid. With the 15min buy signal as well I am expecting a rally back into the 2090s, most likely to test key resistance in the 2099-2101 area at the 50 hour MA and 50 day MA and EMA. I have marked up a possible IHS on the chart, which could morph into a double bottom on a retest of yesterday’s lows. SPX 15min chart:
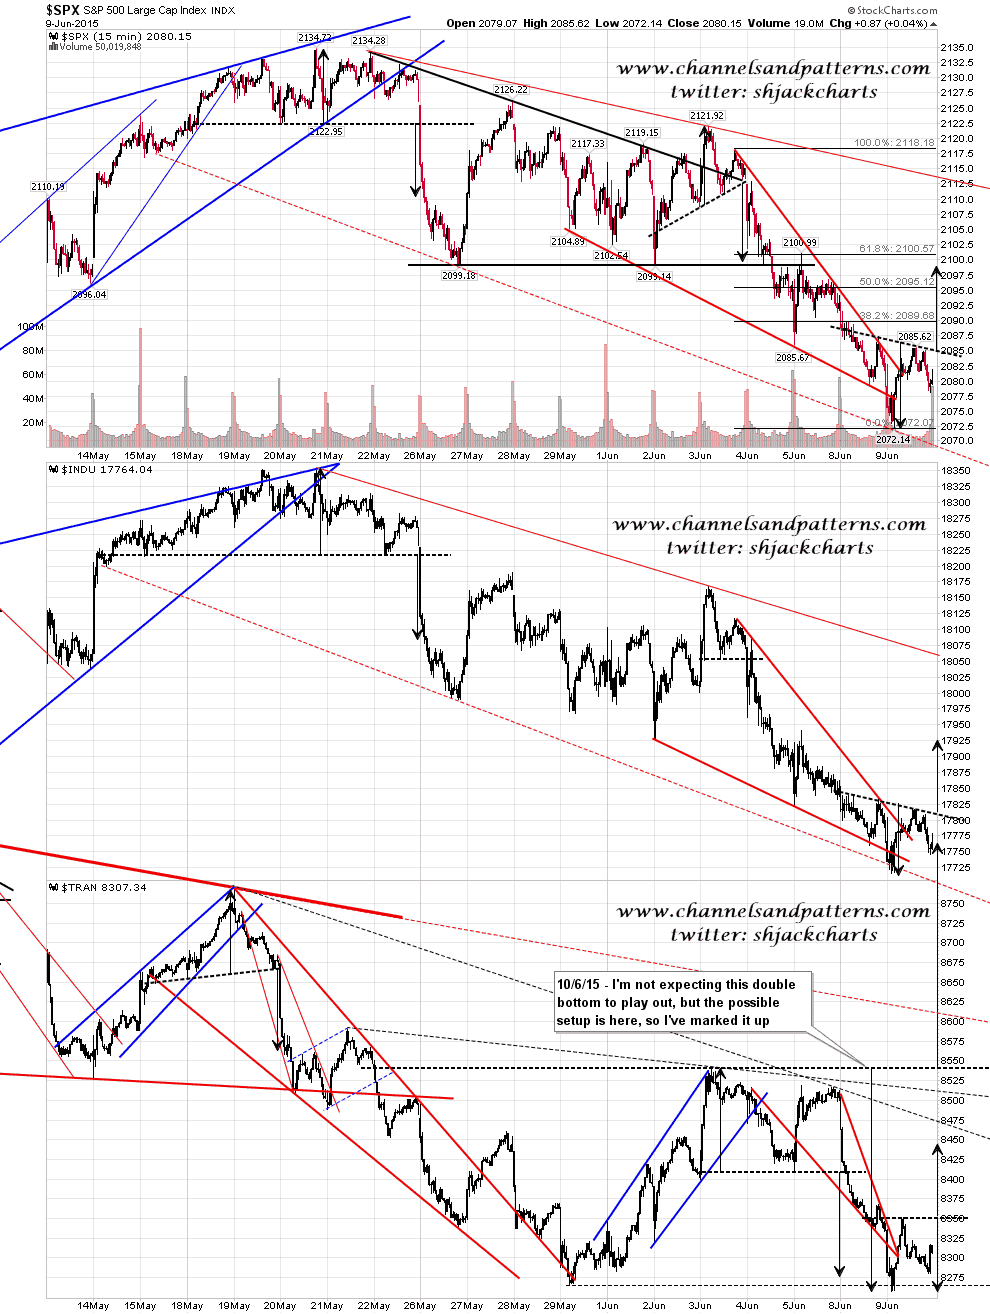
INDU and TRAN are supportive of a rally, with two more falling wedges that have broken up, and a part formed IHS and double bottom respectively. Scan 3x 15min SPX INDU TRAN charts:
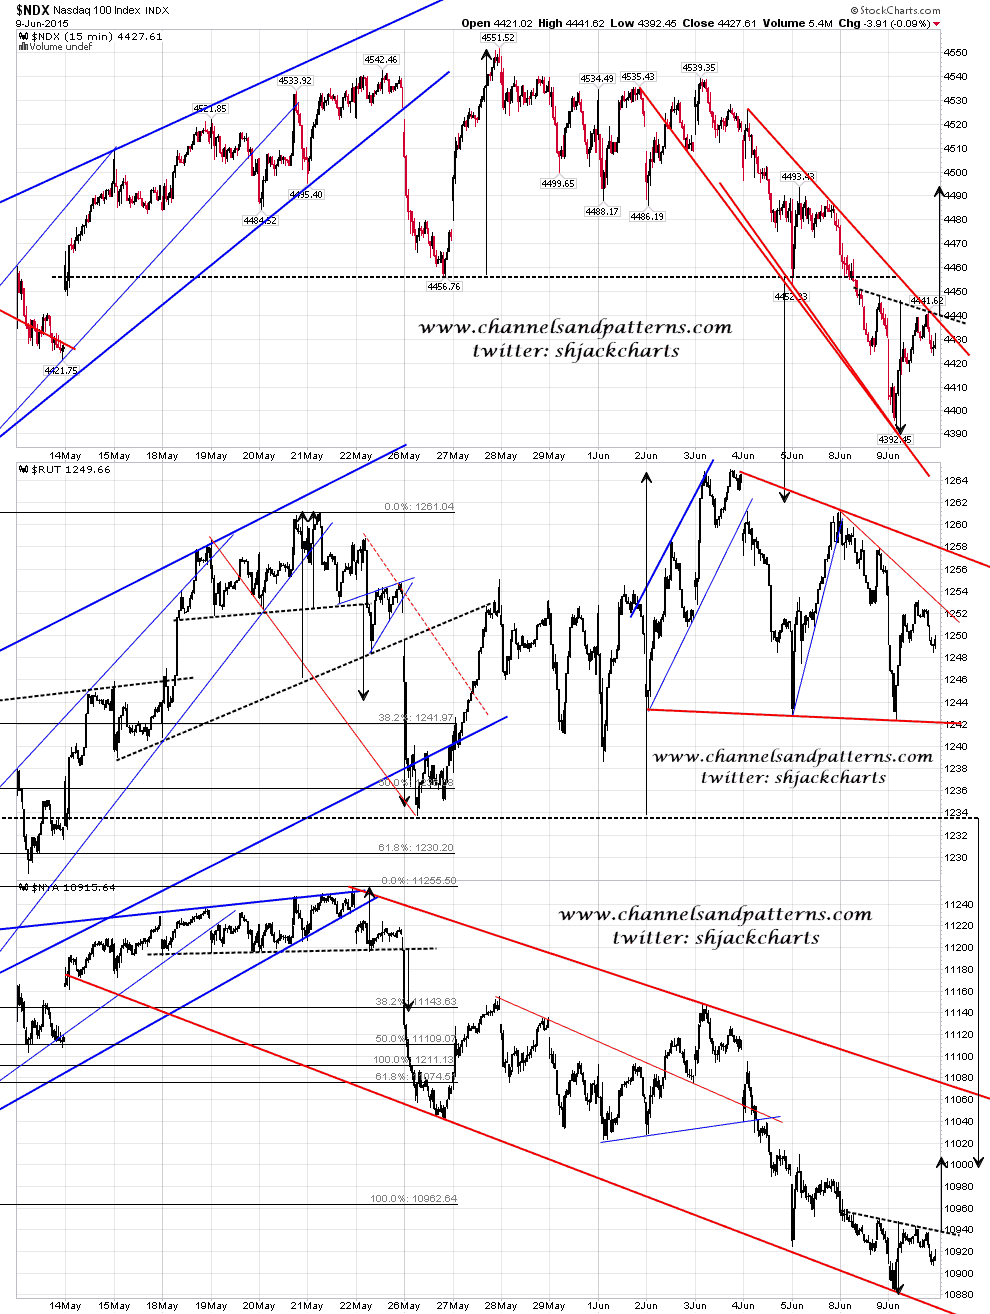
There is a falling megaphone on NDX that has still yet to break up, with another part-formed IHS. RUT and NYA both look ready for more upside as well. Scan 3x 15min NDX RUT NYA charts:
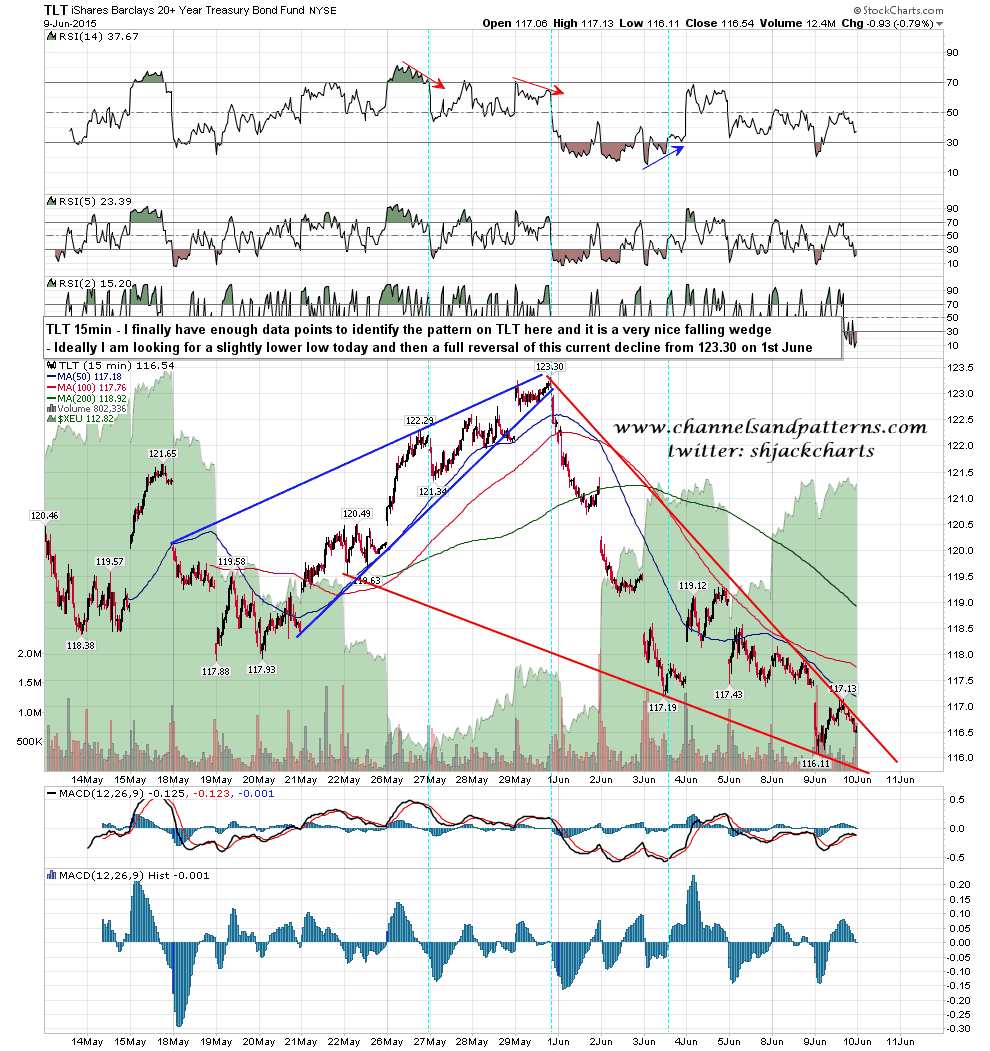
TLT has been a bit of a mystery the last few days but I had enough data points yesterday to identify the pattern, which is a decent falling wedge. ideally this will make a slightly lower low today and then break up to retrace the full move down from 1st June. TLT 15min chart:
Is a rally guaranteed here? No, as there is no such thing as a sure thing in this business. The setup is good though and I think the highest probability outcome here is a move back into the 2090s to test overhead resistance. The next week or two should depend on whether the rally breaks up or fails at resistance there.
NOTE: I got this post out on my blog an hour before the open but had to go to a meeting before I could do the SOH version. Unfortunate timing all round as I missed the open & the move up I predicted & most likely few at SOH read it before the open. Murphy’s’s law.
