
The low yesterday confirmed a triangle option that I wasn’t looking hard at, but I’d not treated as the main triangle option here. It’s big, and when it breaks I’m expecting it to break up. In the meantime Stan’s expecting a marginal lower low today and that would be a false break down as long as the equivalent triangles marked on RSI don’t break down. Resistance is now at yesterday’s broken support in the 2087 area, and Stan is looking for support today in the 2069-73 area, though it could run a little lower. SPX daily chart:

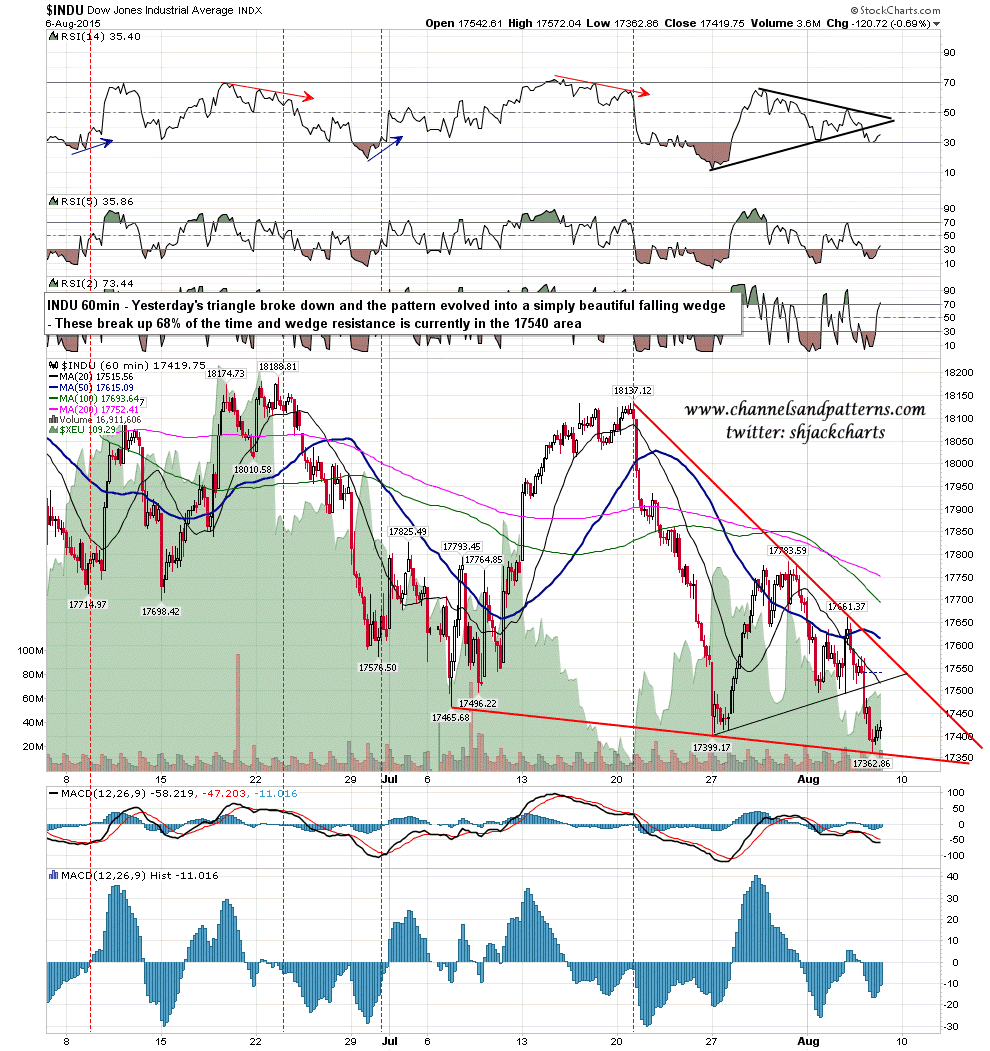
The really interesting pattern to emerge yesterday however was on Dow, where the triangle I showed yesterday morning with the solid three touch resistance trendline has evolved into a perfect falling wedge. These break up 68% of the time and this pattern is strongly supporting my expectation that the SPX triangle will break up. If we see a lower low below the falling wedge today I’ll be working on the assumption that would be a bullish underthrow of this falling wedge before it breaks up. Dow 60min chart:
Is there a risk that this all breaks down instead? Definitely. Technical Analysis only weighs the odds of particular outcomes, as no-one can actually discern the future. If we do see a hard break down on SPX below 2040 then I’d be looking for a move to the 1950 area, and both this triangle and the falling wedge would support that move, as by then I’d expect both to have broken down with conviction. Until then this is a bullish setup, with likely support not far under yesterday’s low, and a target range on a break up in the 2165-95 area. If we see that move it should be a termination move that leads directly into a much stronger pullback.
Both Fridays and NFP days have leaned bearish in recent months. Everyone have a great weekend. 🙂
