
I said to somebody last week that topping processes would often last until you were completely bored with them, and then they’d run on a bit longer, and this topping process has been a good case in point.
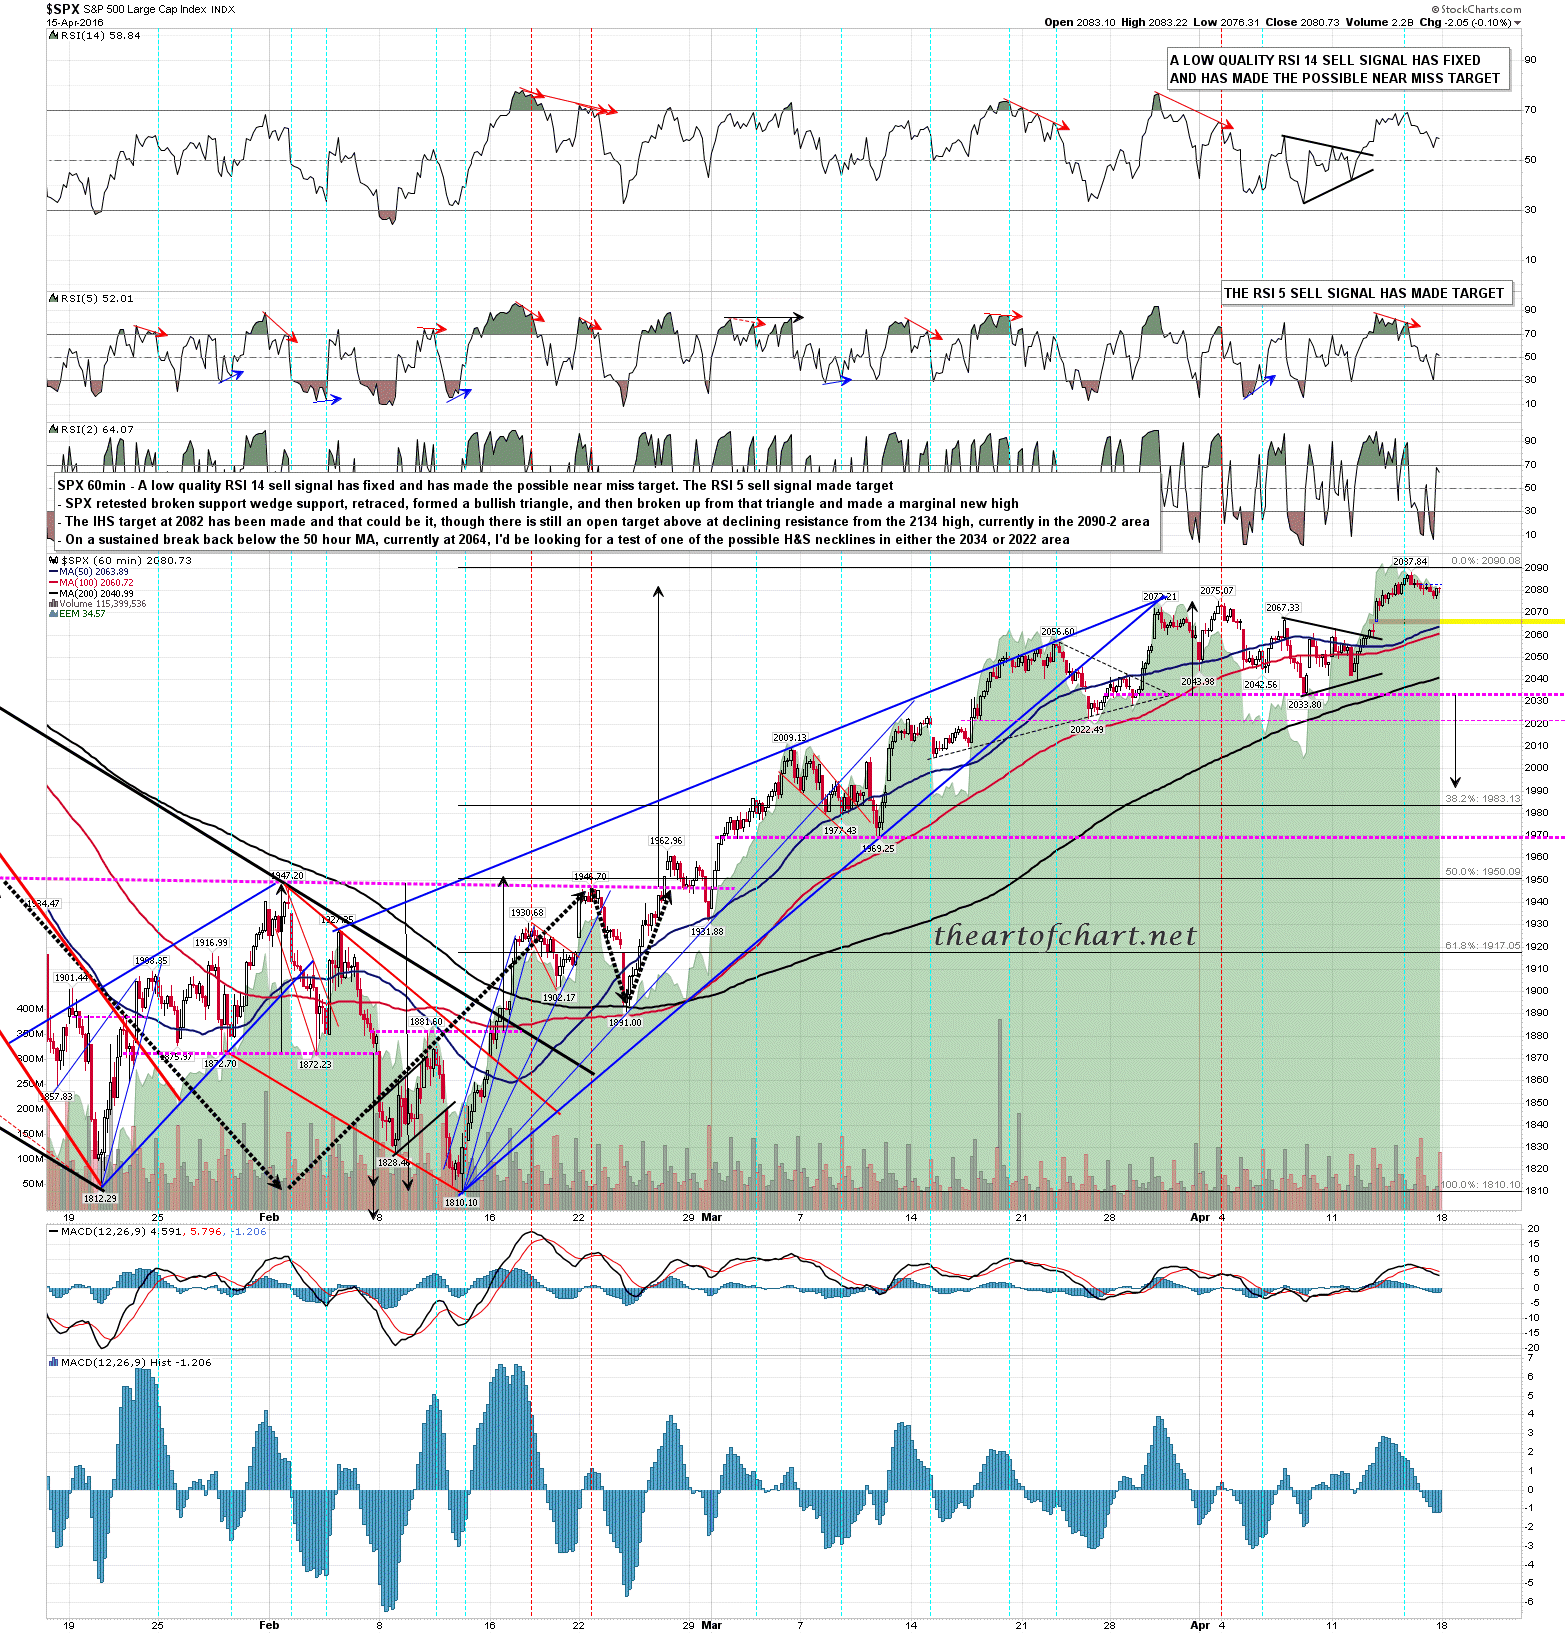
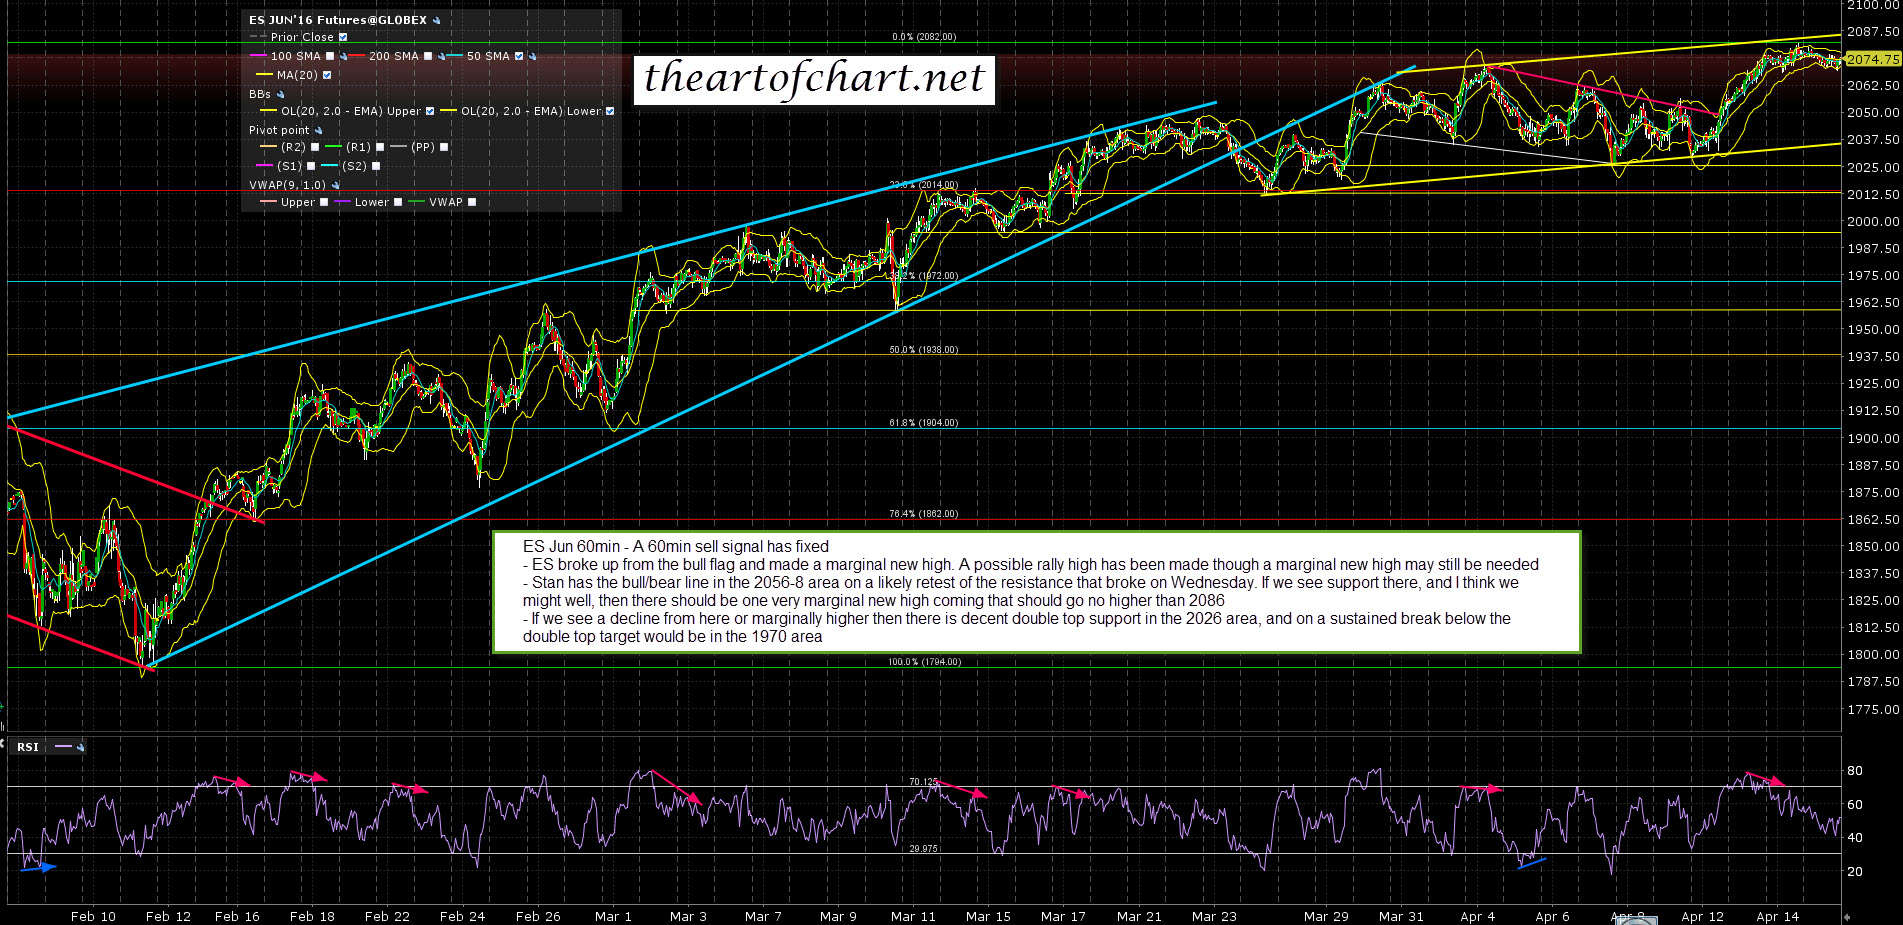
I was saying on Friday that the ideal high would be just a little higher and that was very much on my mind as SPX was retracing a bit on Friday and retracing further on ES overnight. Stan was looking for a backtest to broken resistance in the 2056-8 area, and I’d been thinking we’d see that in trading hours but we saw that last night instead. That support held, the sell signals on the ES, NQ and TF charts all made target or very close (TF), and 60min buy signals fixed on both ES and NQ, which is why I was talking about a likely run to a marginal new high on twitter before the open.
SPX obviously retraced less than ES but the SPX 60min RSI 5 sell signal from Friday morning made target at the low on Friday. Key support is at the 50 hour MA in the 2064 area, and that was of course the equivalent to the ES area that held overnight. SPX 60min chart:
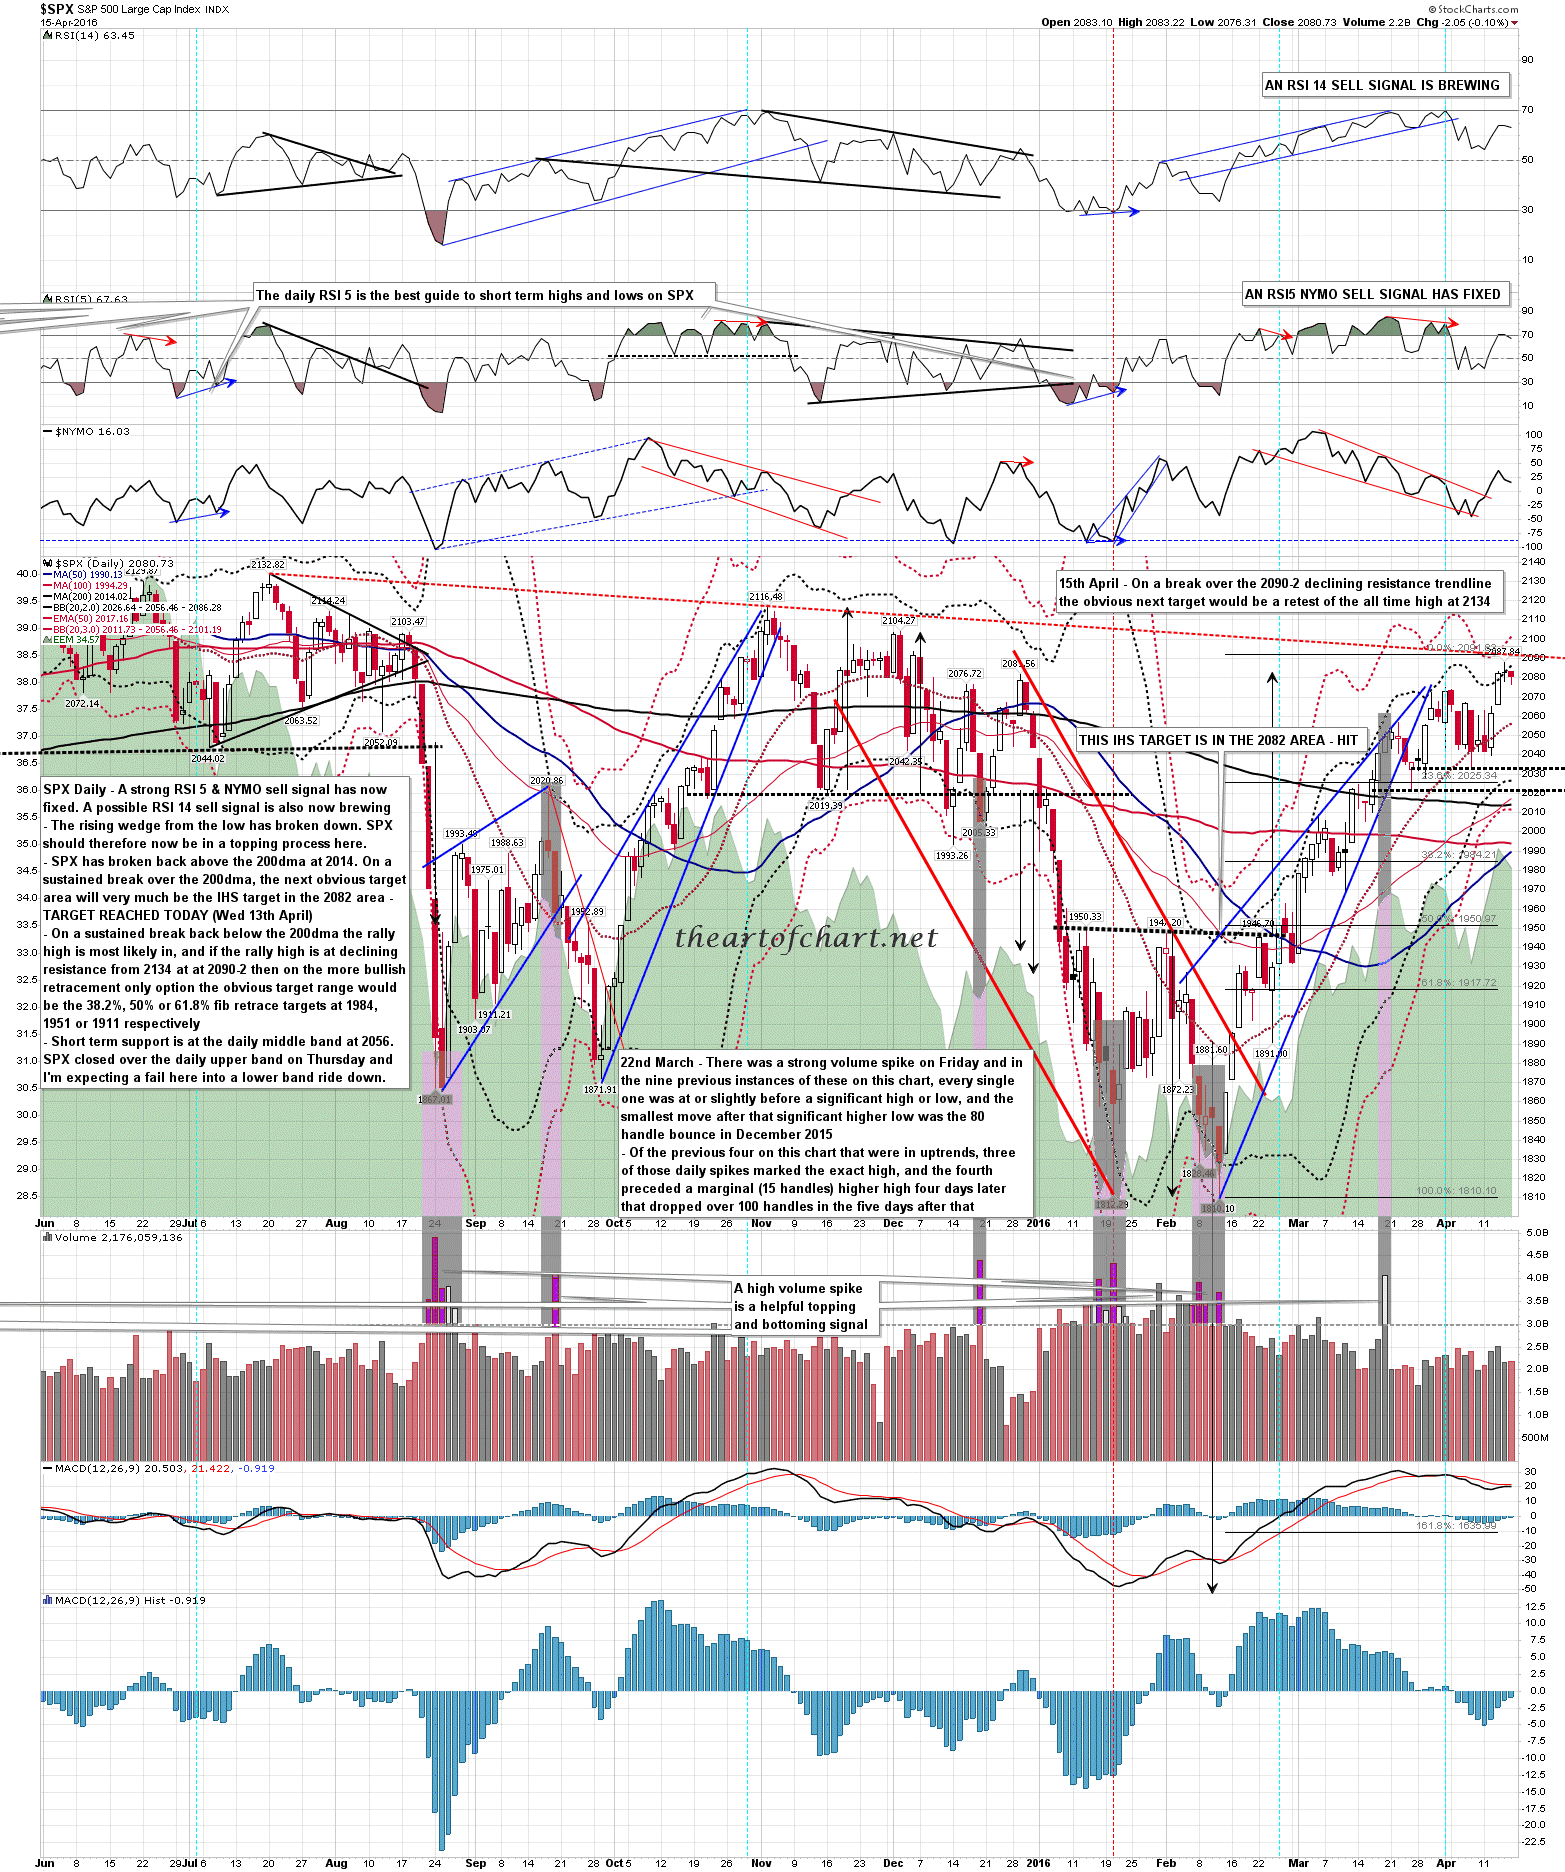
On the daily chart main trendline resistance is in the 2090-2 area and the HOD as I write is now at 2090.33. The test of that target area has now started. The daily upper band is at 2091.21 at the time of writing. SPX daily chart:
The ES chart below is the one I posted for theartofchart.net subscribers last night. With the retracement overnight the 60min sell signal made target and a 60min buy signal fixed after the overnight low. Both that 60min buy signal and the one on NQ have now made target as I’ve been writing. ES Jun 60min chart:
SPX is now testing the trendline target area and whether that target trendline holds has big implications. If it holds then the obvious target on SPX would be a test of rising support from the 2009 low, currently in the 1770 area. If it breaks we’ll still most likely see a big retracement, but it would be unlikely to threaten the 1810 low.
